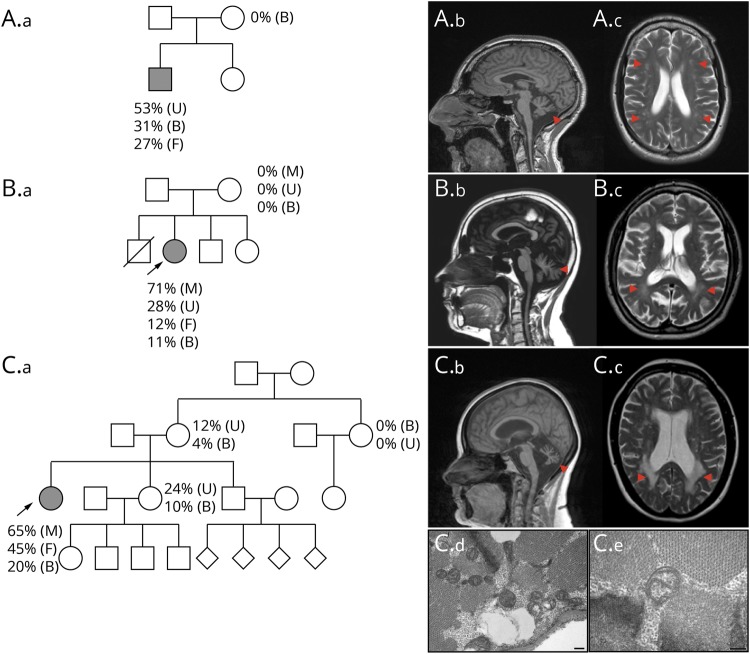
Figure 1. Pedigrees and brain MRI findings.
(A.a) Family pedigree chart of patient 1 (P1) harboring m.8782 G>A; p.(Gly86*) mutation. Brain MRI showing cerebellar atrophy (red arrowhead, A.b) and multiple deep and periventricular white matter changes (red arrowheads, A.c). (B.a) Family pedigree chart of patient 2 (P2) harboring m.8782G>A; p.(Gly86*) mutation. Brian MRI showing reduced brain volume, marked global cerebellar, and brainstem atrophy (red arrowhead, B.b) and multiple deep and periventricular white matter changes (red arrowheads, B.c). (C.a) Family pedigree chart of patient 3 (P3) harboring m.8618dup; p.(Thr33Hisfs*32) mutation. Brain MRI showing severe cerebellar atrophy (red arrowhead, C.b) and posterior white matter abnormalities (red arrowheads, C.c). Electron microscopy showing several mitochondria with simplified internal structure (C.d). High magnification (C.e) showing a mitochondria with aberrant cristae formation. Scale bar represents 200 nm. Filled symbols indicate affected individuals. Symbols with diagonal strikethrough indicate deceased. Arrows indicate probands. Mutation load detectable in different tissues: B = blood; F = fibroblasts; M = muscle; U = urine.

