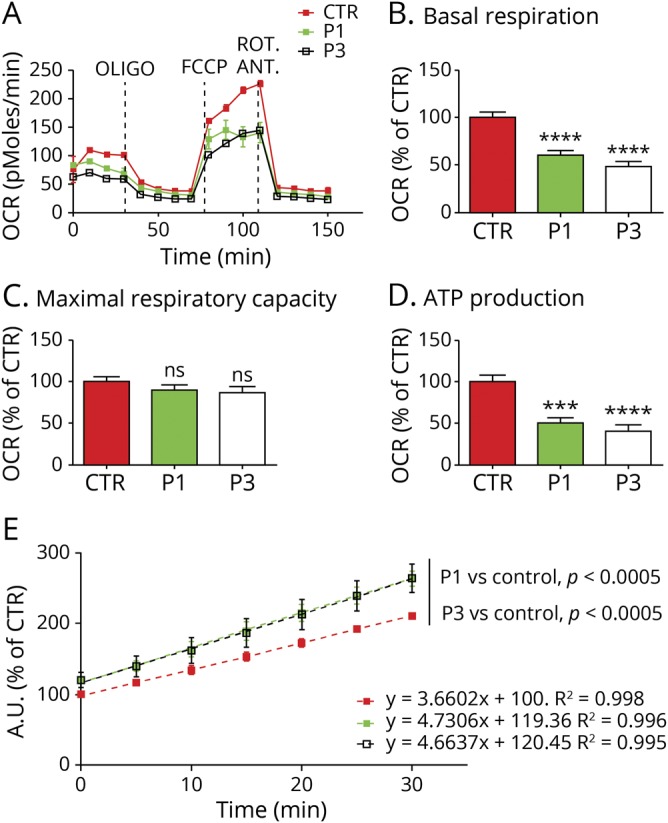
Figure 3. Microscale oxygraphy and reactive oxygen species measurement.

(A) Representative graph illustrating the protocol used to measure mitochondrial respiration in fibroblasts using a XF96 extracellular flux analyzer (Seahorse Bioscience). The data represent the outcome of an experimental run before normalization. Bar charts showing (B) basal respiration, (C) maximal Respiratory capacity, and (D) ATP production. Data are the average of 3 biological replicates, n = 30–50 measurements. OCR were normalized to the number of cells and expressed as percentage of control. Error bars represent SEM, ***p < 0.0005, ****p < 0.0001 by unpaired Student t test. (E) Linear regression of the time course analysis of reactive oxygen species production measured by DCFDA in cultured fibroblasts. Error bars represent SEM, statistical analysis performed by paired t test. Color code as in A. ANT = antimycin; FCCP = carbonyl cyanide 4-(trifluoromethoxy) phenylhydrazone; ns = nonsignificant; OCR = oxygen consumption rates; OLIGO = oligomycin; ROT = rotenone; SEM = standard error of the mean.
