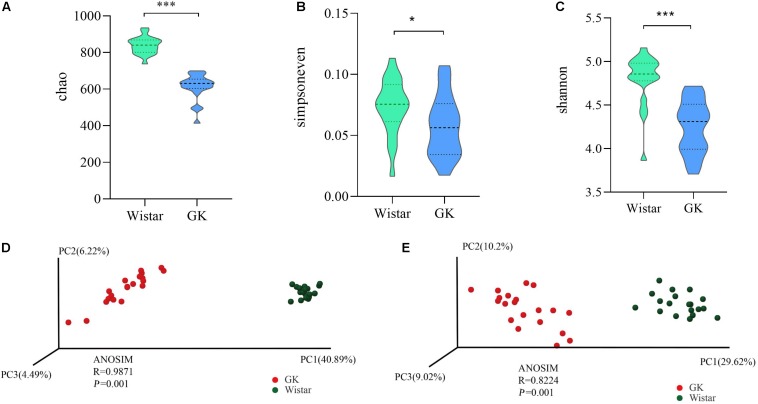
FIGURE 2.
Gut microbial diversity in GK and Wistar rats. Alpha diversity was evaluated based on the Chao (A), Simpsoneven (B), and Shannon (C) indices of the OTU levels. ∗P < 0.05, ∗∗∗P < 0.001. Principal coordinates analysis of beta diversity was based on the weighted UniFrac (D) and Bray-Curtis (E) analyses of the OTU levels.

