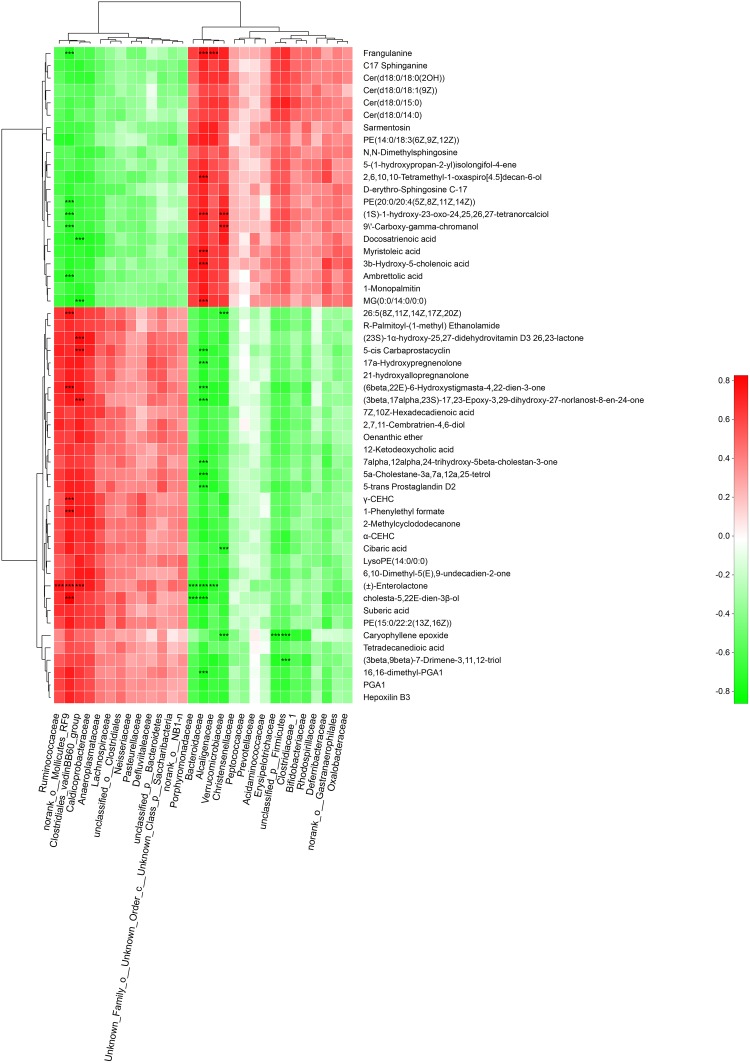
FIGURE 9.
Spearman’s correlation analysis between the gut bacteria phyla and altered fecal metabolites. Positive and negative correlations are shown as red and green in the heat map, respectively. Significant microbiota-metabolite correlations were determined based on an | r | ≥ 0.75 and P < 0.01 (∗∗∗P < 0.001).

