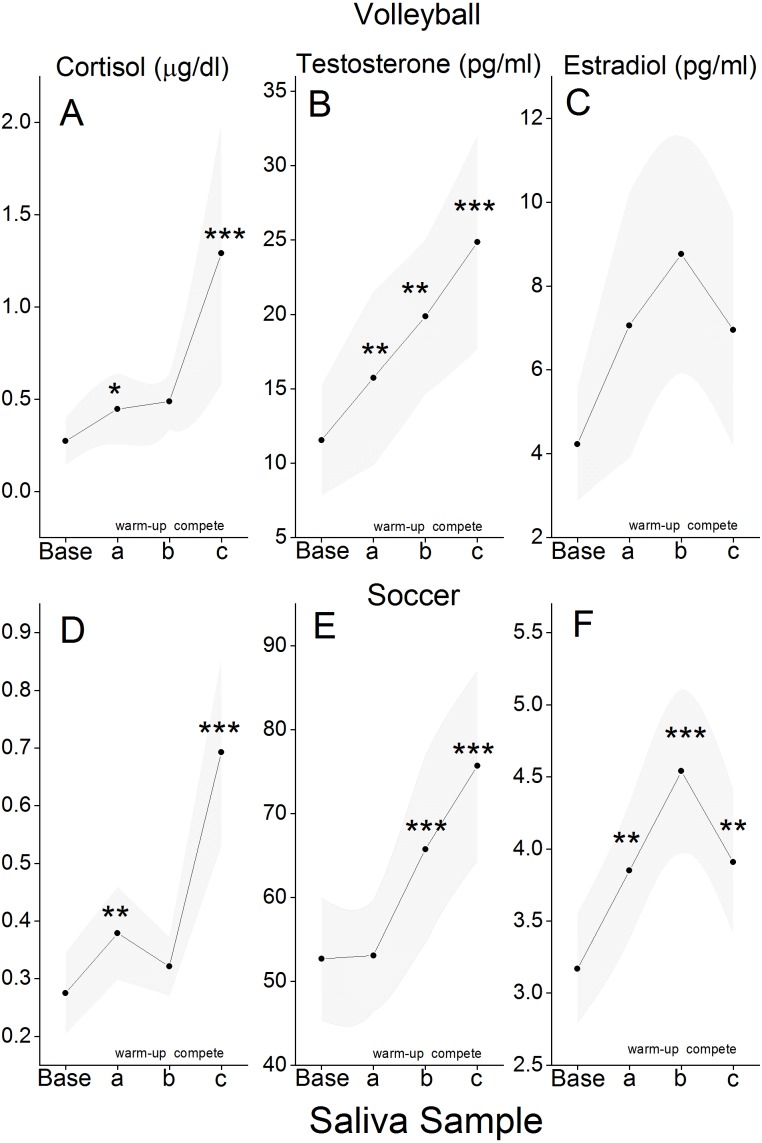
Figure 2. Mean hormone values for different stages of competition.
Saliva samples were obtained on a neutral-day (Base) and at three different times on the day of competition. Sample a was obtained before warm-up; sample b was obtained either mid-warm-up (Volleyball) or immediately after the end of warm-up (Soccer); sample c was obtained immediately after the end of competition. Group means (Cortisol: (A) and (D); testosterone: (B) and (E); estradiol: (C) and (F)) are for those individuals who actually played in the competition (Volleyball, N = 9; Soccer, N = 17). Ninety-five percent confidence intervals are shown as shaded bands. Symbols (∗p ≤ .05; ∗∗p ≤ .02; ∗∗∗p ≤ .01) represent instances where the group mean is significantly different from the one for the preceding sample. Cohen’s d values for statistically significant differences ranged from .64 to 2.4. Team differences with respect to mean hormone levels are likely attributable to the fact that assays for the volleyball and soccer teams were performed with kits from two different manufacturers.

