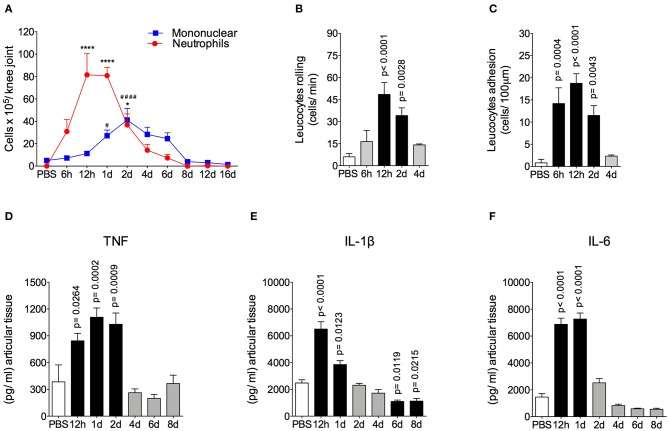
Figure 1.
Time course of inflammatory response in AIA model. (A) Number of neutrophils and mononuclear cells in the knee joint cavity at different time points after injection of 10 μg of mBSA (10 μg/10 μl of PBS), as well as 12 h after injection of 10 μl of sterile phosphate buffered saline (PBS) into the knee joints of immunized mice (n = 4–6). (B) Rolling and (C) adhesion of leukocytes in knee joint microvasculature (n = 5). Concentration of (D) TNF, (E) IL-1β and (F) IL-6 in the joint tissue homogenate were evaluated by ELISA (n = 5). The results are represented as mean ± SEM; *p < 0.05, ****(to neutrophils), and #### (to mononuclear cells) p < 0.0001 (A) or p = specified value in the graph (B–F) compared to control group (PBS) using one-way ANOVA following by Dunnett post-hoc analysis.

