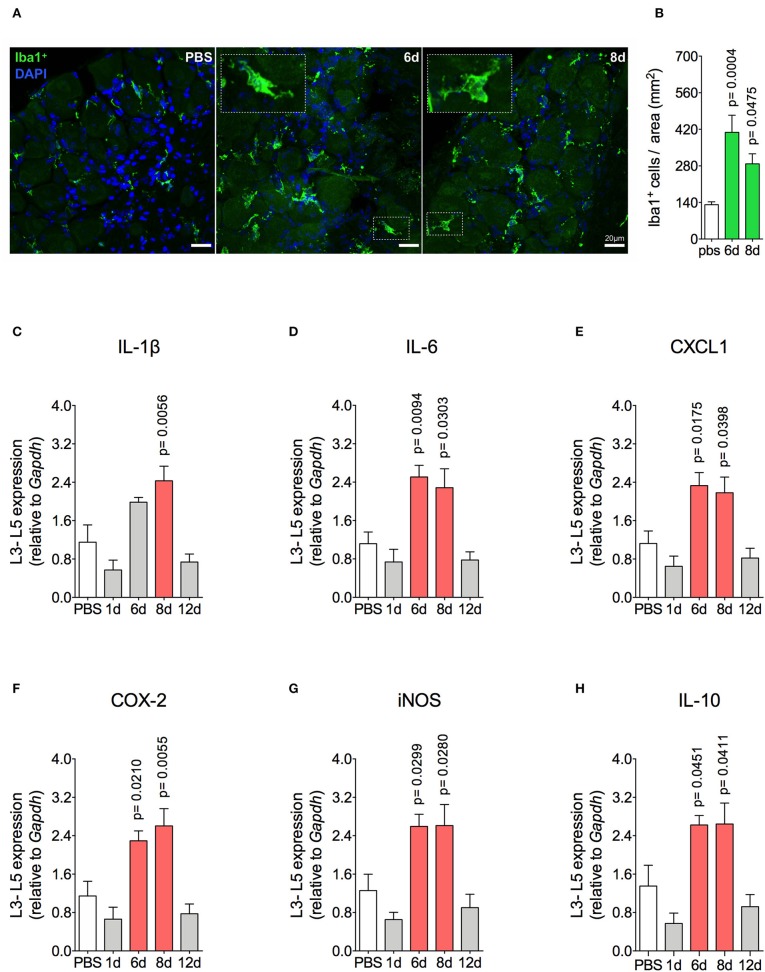
Figure 4.
Resident macrophage activation and inflammatory molecules gene expression characterizes inflammatory status of DRG after resolution of inflammation in AIA model. Immunized mice received either i.a. injection of mBSA (10 μg/10 μl of PBS) to AIA induction or PBS (10 μl) in control group. (A) Confocal microscopy slides show marked Iba1+ cells within DRG (L4) 8 days after AIA induction and (B) its quantification (n = 5). Time course of gene expression of (C) IL-1β, (D) IL-6, (E) CXCL1, (F) COX-2, (G) iNOS, and (H) IL-10 within lumbar DRG (L3–L5). DRG samples from the control group were extracted 8 days after i.a. injection (n = 5). The results are represented as mean ± SEM; p = specified value in the graph compared to control group (PBS) using ANOVA following by Dunnett post-hoc analysis.

