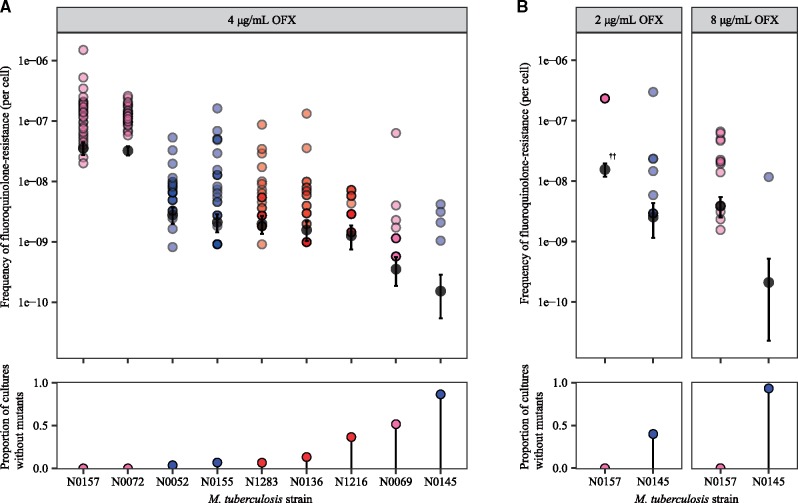
Fig. 1.
Variation in the frequency of ofloxacin-resistance between genetically distinct, wild-type Mycobacterium tuberculosis strains. (A) Frequency of ofloxacin-resistance at 4 µg/ml ofloxacin (OFX), as measured by fluctuation analysis. Top panel: colored points represent the frequency of ofloxacin-resistance per cell per parallel culture, with darker points representing multiple cultures with the same frequency. Colors denote the lineage that the Mtb strain belongs to (L1, pink; L2, blue; L4, red). Gray points represent the estimated number of drug-resistance mutations per cell per strain as calculated by MSS-MLE, while black bars denote the respective 95% confidence intervals. Bottom panel: the percentage of parallel cultures lacking OFX-resistant mutants. (B) Frequency of ofloxacin-resistance at 2 or 8 µg/ml OFX. ††Due to restrictions on the range of values that the MSS-MLE method is valid for (see Materials and Methods), the estimated number of drug-resistance mutations per cell for N0157 at 2 µg/ml OFX, as presented here, is an underestimate.

