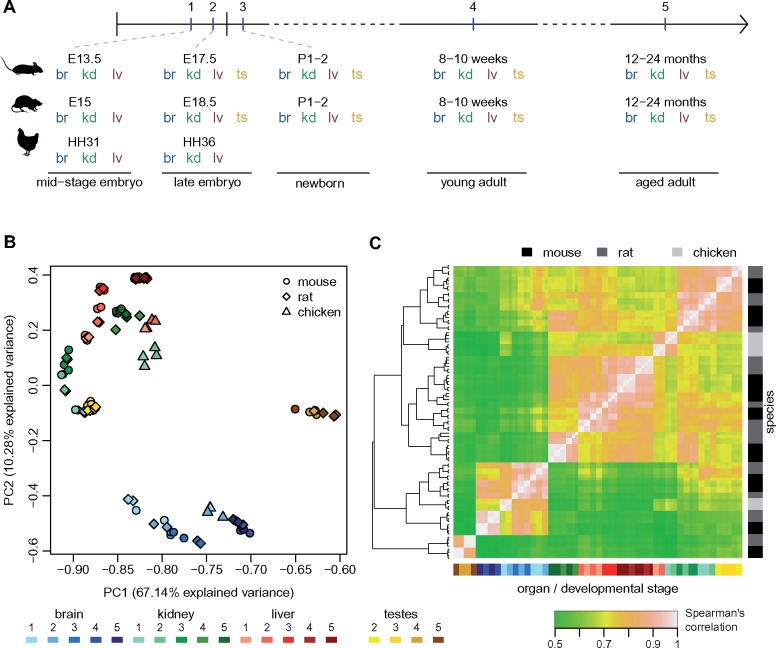
Fig. 1.
Comparative transcriptomics across species, organs, and developmental stages. (A) Experimental design. The developmental stages selected for mouse, rat, and chicken are marked on a horizontal axis. Organs sampled for each species and developmental stage are shown below. Abbreviations: br, brain; kd, kidney; lv, liver; ts, testes. (B) First factorial map of a principal component analysis, performed on log2-transformed TPM values, for 10,363 protein-coding genes with orthologs in mouse, rat, and chicken. Colors represent different organs and developmental stages, point shapes represent different species. (C) Hierarchical clustering, performed on a distance matrix derived from Spearman correlations between pairs of samples, for 10,363 protein-coding genes with orthologs in mouse, rat, and chicken. Organ and developmental stages are color-coded, shown below the heatmap. Species of origin is color-coded, shown on the right. Sample clustering is shown on the left.

