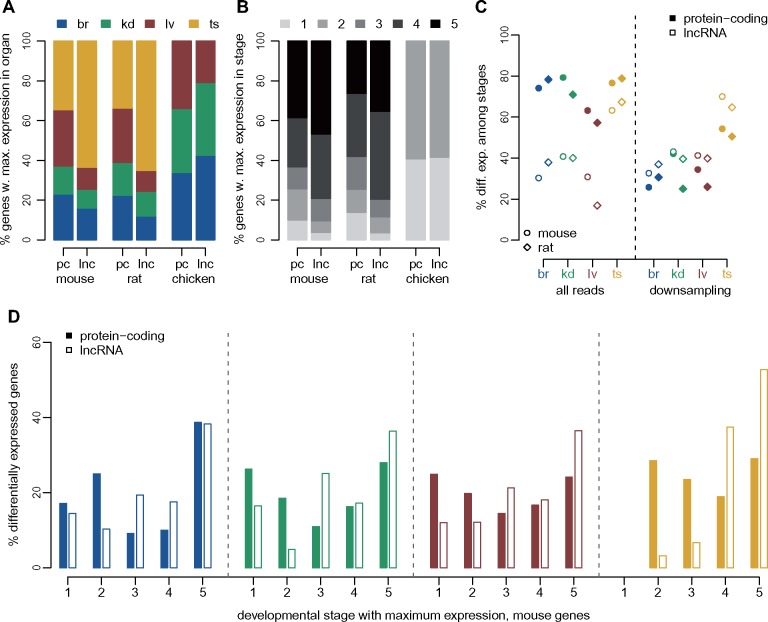
Fig. 3.
Different expression patterns for protein-coding genes and lncRNAs. (A) Distribution of the organ in which maximum expression is observed, for protein-coding genes (pc) and lncRNAs (lnc), for mouse, rat, and chicken. Organs are color-coded, shown above the plot. We defined the sample in which maximum expression is observed based on an average expression values across replicates, for each organ/developmental stage combination (supplementary methods, Supplementary Material online). (B) Distribution of the developmental stage in which maximum expression is observed, for protein-coding genes and lncRNAs, for mouse, rat, and chicken. Developmental stages are color-coded, shown above the plot. (C) Percentage of protein-coding and lncRNA genes that are significantly (FDR<0.01) differentially expressed (DE) among developmental stages, with respect to the total number of genes tested for each organ. Left panel: differential expression analysis performed with all RNA-seq reads. Right panel: differential expression analysis performed after down-sampling read counts for protein-coding genes, to match those of lncRNAs (see Materials and Methods). (D) Distribution of the developmental stage in which maximum expression is observed, for protein-coding genes and lncRNAs that are significantly DE (FDR<0.01) in each organ, for the mouse. Percentages are computed with respect to the total number of DE genes in each organ and gene class.

