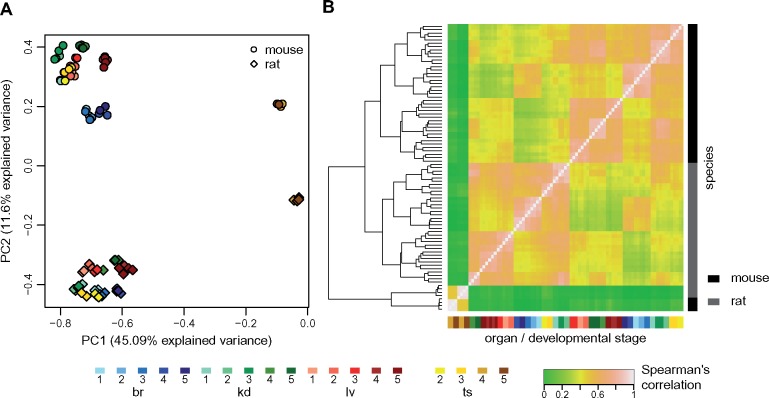
Fig. 6.
Global comparison of lncRNA expression patterns across species. (A) First factorial map of a principal component analysis, performed on log2-transformed TPM values, for 2,893 orthologous lncRNAs between mouse and rat. Colors represent different organs and developmental stages, point types represent species. (B) Hierarchical clustering, performed on a distance matrix derived from Spearman correlations between pairs of samples, for 2,893 orthologous lncRNAs between mouse and rat. Organ and developmental stages are shown below the heatmap. Species of origin is shown on the right. Sample clustering is shown on the left.

