Fig. 7.
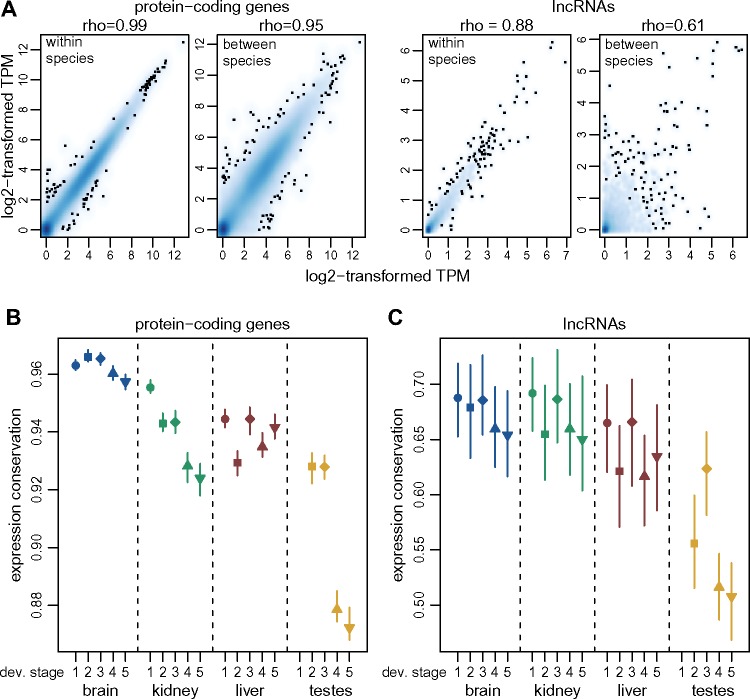
Global estimates of expression conservation across organs and developmental stages. (A) Example of between-species and within-species variation of expression levels, for protein-coding genes (left) and lncRNAs (right), for orthologous genes between mouse and rat, for the midstage embryonic brain. Spearman’s correlation coefficients (rho) are shown above each plot. We show a smoothed color density representation of the scatterplots, obtained through a 2D kernel density estimate (smoothScatter function in R). (B) Expression conservation index, defined as the ratio of the between-species and the within-species expression level correlation coefficients, for protein-coding genes, for each organ and developmental stage. The vertical segments represent minimum and maximum values obtained from 100 bootstrap replicates. We analyzed 15,931 pairs of orthologous protein-coding genes. (C) Same as (B), for lncRNAs. We analyzed 2,893 orthologous mouse and rat lncRNAs.

