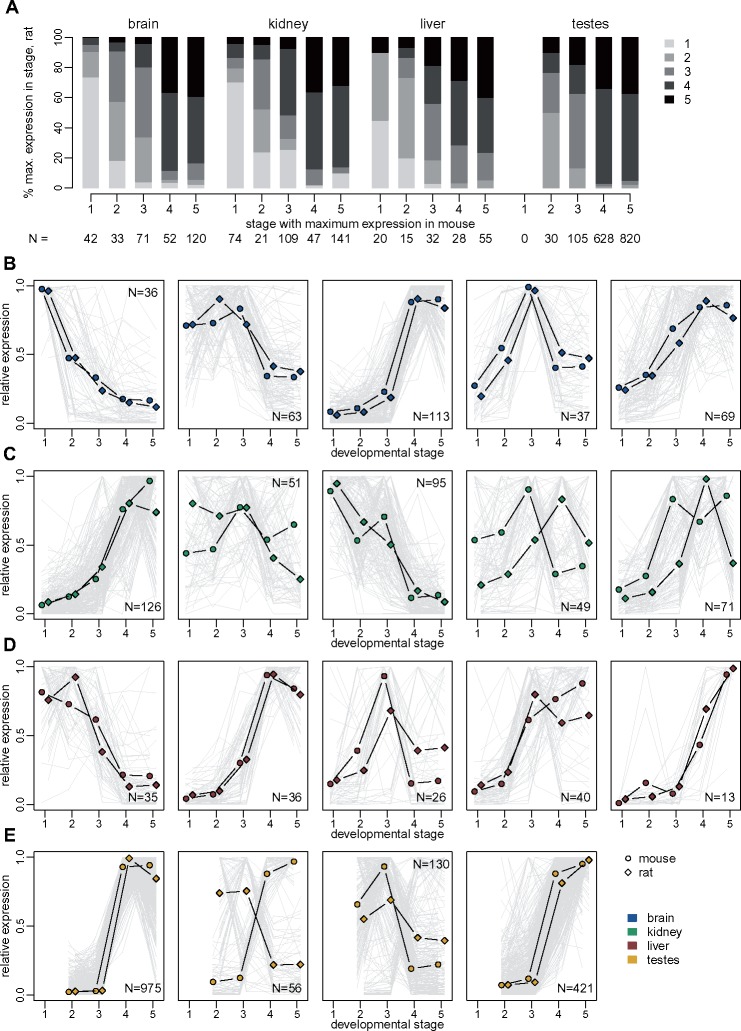
Fig. 8.
Conservation of developmental expression patterns of differentially expressed lncRNAs. (A) Comparison of the developmental stage in which maximum expression is observed, for orthologous lncRNAs that are significantly differentially expressed (FDR<0.01) among developmental stages, for both mouse and rat. The sample in which maximum expression is observed is computed based on an average expression values across biological replicates, for each organ/developmental stage combination (supplementary methods, Supplementary Material online). Genes are divided into classes based on the developmental stage where maximum expression is observed in mouse organs (x axis). The y axis represents the percentage of orthologous genes that reach maximum expression in each developmental stage, in the rat. Numbers of analyzed genes are shown below the plot. (B) Expression profiles of orthologous lncRNAs that are significantly differentially expressed (FDR<0.01) among developmental stages, for both mouse and rat, in the brain. TPM values were averaged across replicates and normalized by dividing by the maximum, for each species. The resulting relative expression profiles were combined across species and clustered with the K-means algorithm. Dots represent the average profiles of the genes belonging to each cluster. Gray lines represent profiles of individual genes from a cluster. Numbers of genes in each cluster are shown in the plot. (C) Same as (B), for the kidney. (D) Same as (B), for the liver. (E) Same as (B), for the testes. For this organ, we searched for only four clusters with the K-means algorithm.

