Fig. 9.
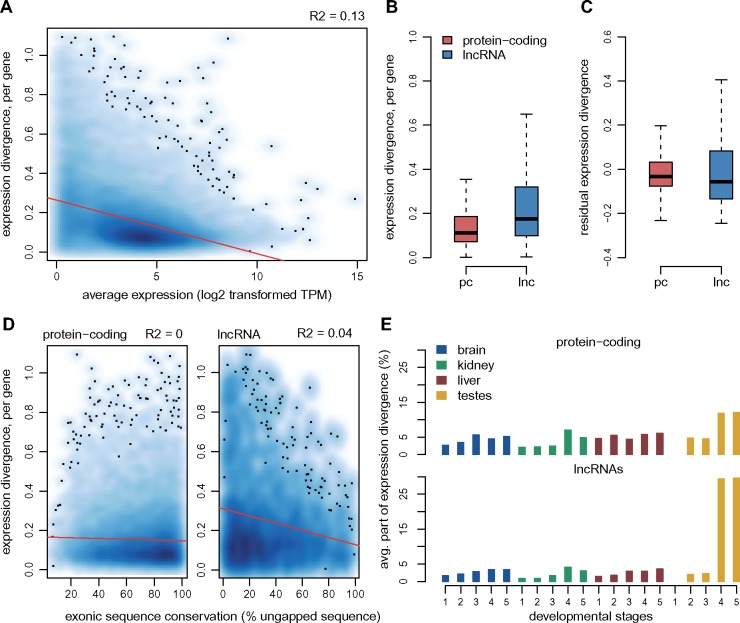
Per-gene estimates of expression pattern divergence between species. (A) Relationship between the per-gene expression divergence measure (Euclidean distance of relative expression profiles among organs/stages, between mouse and rat), and the average expression values (log2-transformed TPM) across all mouse and rat samples. We show a smoothed color density representation of the scatterplots, obtained through a 2D kernel density estimate (smoothScatter function in R). Red line, linear regression. (B) Distribution of the expression divergence value for all protein-coding and lncRNA genes with predicted 1-to-1 orthologs in mouse and rat. (C) Distribution of the residual expression divergence values, after regressing the average expression level, for protein-coding genes and lncRNAs. (D) Relationship between expression divergence and exonic sequence conservation (% exonic sequence aligned without gaps between mouse and rat), for protein-coding genes and lncRNAs. (E) Average contribution of each organ/developmental stage combination to expression divergence, for protein-coding genes and lncRNAs.

