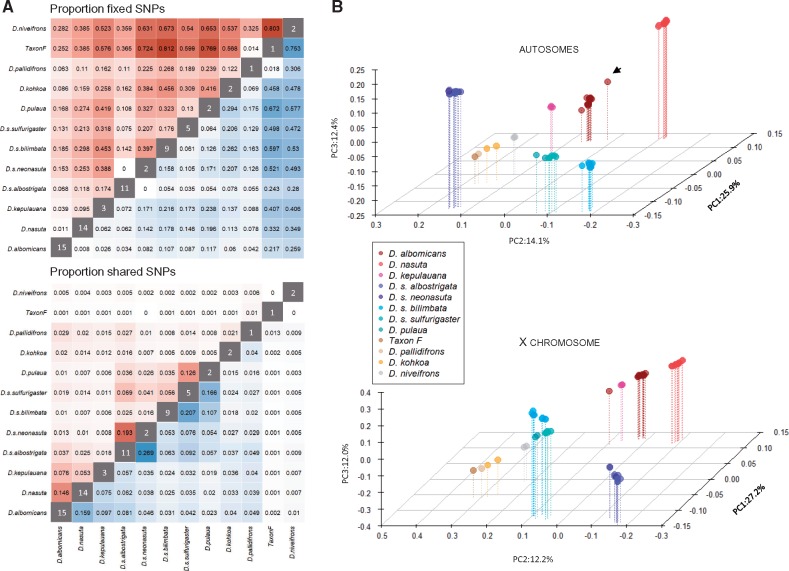
Fig. 3.
Patterns of genome-wide differentiation in the nasuta group. (A) Proportion of fixed (top) and shared (bottom) SNPs in the nasuta group between the X chromosomes (red) and autosomes (blue). Darker shading indicates larger values. The values in the diagonal indicate the sample size. (B) Principle component analysis of autosomal (top) and X-linked (bottom) SNPs in the nasuta species group. The black arrow indicates Drosophila albomicans E-10815_SHL48.

