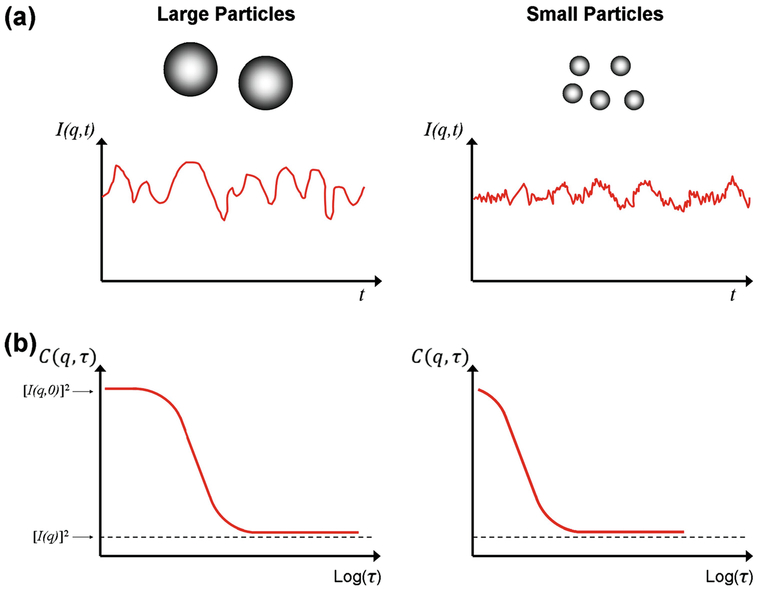
Fig. 3.
Schematic scattering intensity as a function of time (a) and autocorrelation function variation with delay time (b) for large and small particle sizes, respectively. Large particles resist random force fluctuations and maintain smoother intensity plots; smaller particles move rapidly in solution and cause jitter in their intensities. Reproduced in part from [37]

