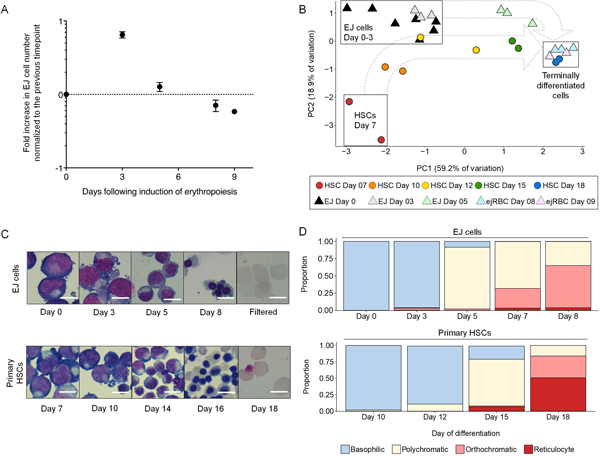
Figure 2:

Differentiation of the ejRBC cell line mirrors erythropoiesis of primary HSCs. (A) Dynamics of EJ cells during the differentiation protocol. Data points reflect fold increase in cell number relative to the previous time point (log10 scale). Average and standard error of mean (SEM) from five experiments are presented. (B) Principal components analysis (PCA) of erythropoiesis marker median fluorescent intensity (MFI) data (adjusted for the background of unstained controls). PCA reflects expression of CD34, CD45, CD36, CD49d, CD71, and GPA, derived from two primary HSC differentiation experiments (circles) and 3–7 EJ cell differentiation experiments (triangles). Principal components 1 and 2 (PC1 and PC2, respectively) are plotted. Dotted arrows outline trajectory of erythropoiesis. PCA variable loadings are presented in Fig. S4. Representative flow cytometry plots of all erythropoiesis markers are presented in Fig. S3. (C) Cell morphology during erythropoiesis. Immortalized EJ cells (top panel) and primary HSCs (bottom panel) are represented at multiple time points during erythropoiesis. Scale bars are 10 μm in length. (D) Representation of erythropoiesis stages during terminal differentiation. Relative frequencies of basophilic (blue), polychromatic (pale yellow), orthochromatic (pink), and enucleated (red) stages are represented at multiple time points during differentiation. EJ cells are represented in the top panel, and primary HSCs are displayed in the bottom panel.
