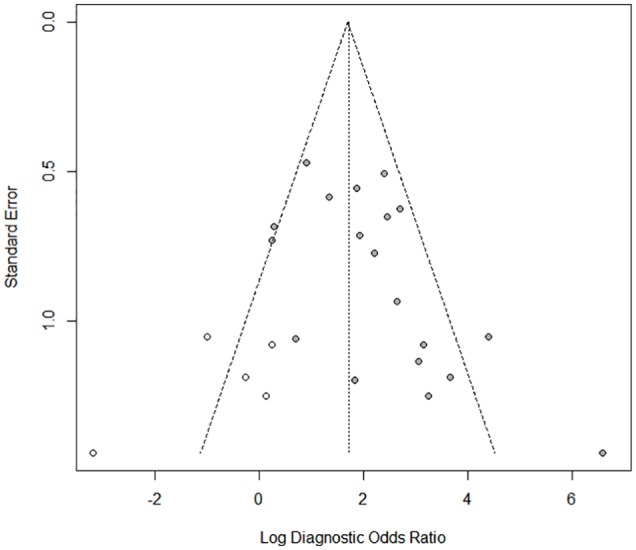
Figure 7.

Funnel plot for meta-analysis analysis of pulse pressure variation for prediction of fluid responsiveness in patients with tidal volume ⩽8 mL kg−1 after applying the trim-and-fill method. Filled circles in the figure show trials included in the meta-analysis, whereas open circles in the figure show unpublished trials.
