
Figure 4.
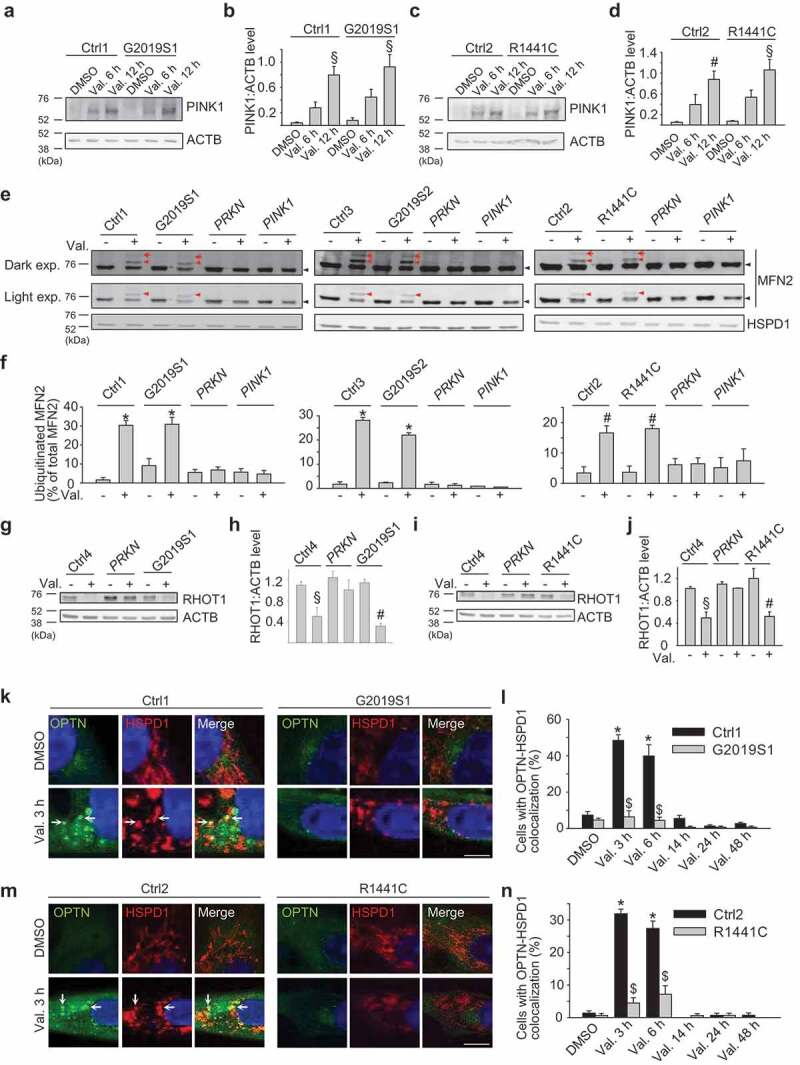
OPTN recruitment to depolarized mitochondria is impaired in PD patients with LRRK2 mutations despite preserved mitochondrial ubiquitination. (a-d) Untransfected control (Ctrl1 and Ctrl2) and LRRK2 mutant (G2019S1 and R1441C) fibroblasts were treated with DMSO or valinomycin (Val., 1 µM) for 6 or 12 h. (a,c) Western blot for endogenous PINK1 and ACTB. (b) Quantification of PINK1:ACTB (n = 3–4). § P < 0.01 and # P < 0.05 compared with DMSO condition in the same subject. (e,f) Untransfected control (Ctrl1, Ctrl2, Ctrl3), LRRK2 (G2019S1, G2019S2, R1441C), PRKN and PINK1 mutant fibroblasts were treated with DMSO or valinomycin (Val., 1 µM) for 3 h. (E) Western blot of mitochondrial fractions for MFN2 and HSPD1. The same MFN2 blots are shown after either light or dark exposure (exp.). Red arrows indicate diubiquitinated MFN2, red arrowheads monoubiquitinated MFN2 and black arrowheads non-ubiquitinated MFN2. (f) Quantification of ubiquitinated MFN2 relative to total MFN2 (n = 3–4). * P < 0.001 and #P < 0.05 compared with DMSO condition in the same subject. (g-j) Control, PRKN and LRRK2 mutant fibroblasts were treated with DMSO or Val. (1 µM) for 6 h. (g,i) Western blot for RHOT1 and ACTB. (h,j) Quantification of RHOT1:ACTB (n = 3). § P < 0.01 and # P < 0.05 compared with DMSO in the same subject. (k-n) Control and LRRK2 mutant fibroblasts were transfected with GFP-tagged OPTN. After 24 h cells were treated with DMSO or Val. (1 µM) for 3, 6, 14, 24 or 48 h. Fibroblasts were immunostained for HSPD1 and nuclei were stained with TOTO-3. Arrows in (k) and (m) indicate mitochondria that colocalize with OPTN. (l,n) Quantification of the percentage of cells with OPTN-HSPD1 colocalization (n = 3). * P < 0.001 compared with DMSO in the same subject. $ P < 0.001 compared with the corresponding Val. condition in the control subject. Scale bars: 10 µm.