
Figure 7.
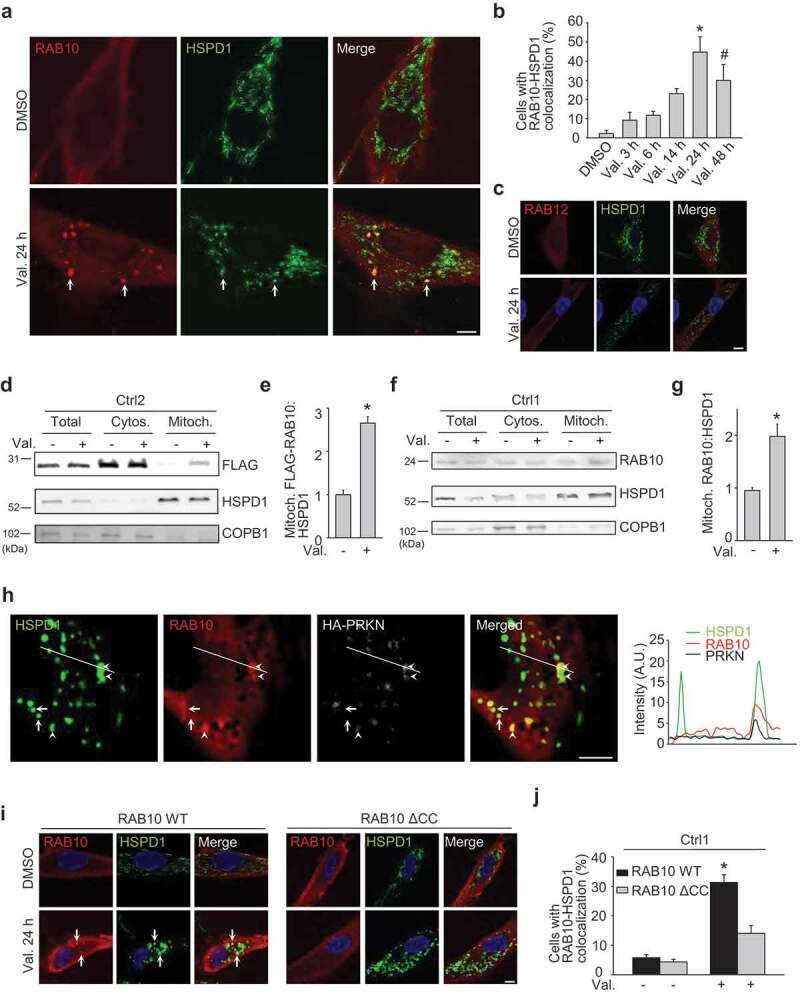
RAB10 accumulates on depolarized mitochondria in wild-type cells. (a-c) Fibroblasts from Ctrl1 were transfected with FLAG-RAB10 (A, B) or FLAG-RAB12 (c). After 24 h cells were treated with DMSO or valinomycin (Val., 1 µM) for the indicated time and immunostained for FLAG and HSPD1. (b) Quantification of the percentage of cells with colocalization of FLAG-RAB10 and HSPD1 (n = 4). * P < 0.001 and # P < 0.05 compared with DMSO. Arrows in (a) indicate examples of RAB10 puncta that colocalize with mitochondria. (d,e) Ctrl2 fibroblasts transfected with FLAG-RAB10 were treated with DMSO or Val. for 14 h, followed by subcellular fractionation and western blotting of total, cytosolic (Cytos.) and mitochondrial (Mitoch.) fractions for FLAG, HSPD1 and the non-mitochondrial protein COPB1. (e) Quantification of FLAG-RAB10:HSPD1 in the mitochondrial fraction (n = 3). * P < 0.001 compared with DMSO. (f,g) Untransfected fibroblasts from Ctrl1 were treated with DMSO or Val. for 14 h, followed by western blotting of subcellular fractions for endogenous RAB10, HSPD1 and COPB1. (g) Quantification of endogenous RAB10:HSPD1 in the mitochondrial fraction (n = 10). * P < 0.001 compared with DMSO. (h) Ctrl1 fibroblasts were transfected with Myc-tagged RAB10 and HA-tagged PRKN. After 24 h cells were treated with DMSO or Val. (1 µM) for 3 h and immunostained for HSPD1, Myc and HA. White arrows indicate examples of mitochondria without PRKN or RAB10 signal. Arrowheads indicate examples of mitochondria that colocalize with PRKN and RAB10 puncta. The graph depicts the relative intensity of each channel over the drawn lines shown in the merged image. A.U., arbitrary units. (i,j) Ctrl1 fibroblasts were transfected with FLAG-tagged wild-type (WT) or ΔCC RAB10 WT. After 24 h cells were treated with DMSO or Val. (1 µM) for 24 h and immunostained for FLAG and HSPD1. Nuclei were stained with TOTO-3. Arrows in (i) indicate examples of RAB10 puncta that colocalize with mitochondria. (j) Quantification of the percentage of cells with colocalization of FLAG-RAB10 and HSPD1 (n = 4). * P < 0.001 compared with all other conditions. Scale bars: 10 µm.