
Figure 8.
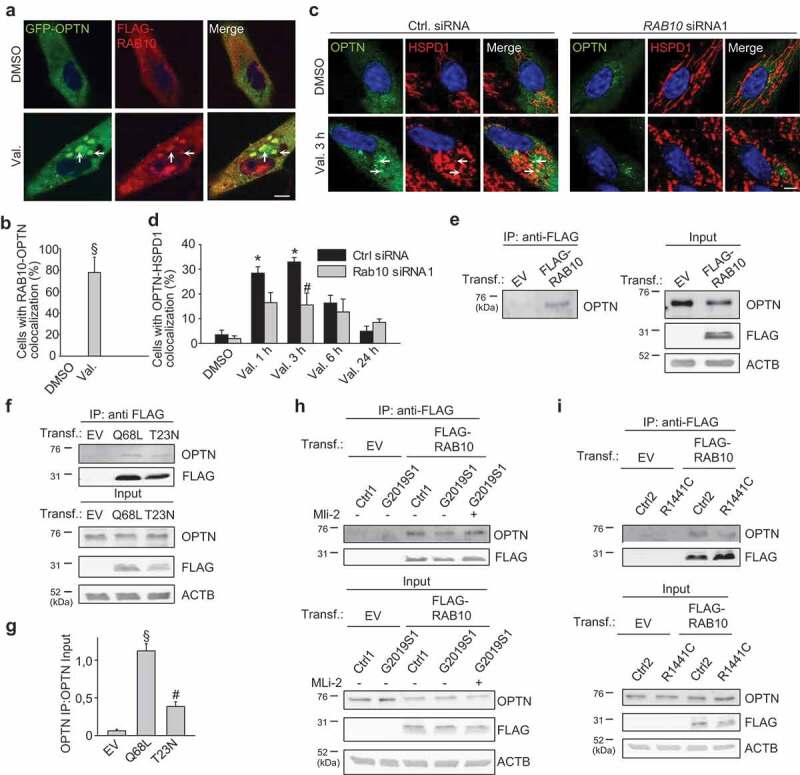
RAB10 colocalizes with OPTN on depolarized mitochondria, promotes mitochondrial OPTN recruitment and binds to OPTN in wild-type cells. (a,b) Fibroblasts from Ctrl1 were transfected with GFP-tagged OPTN and FLAG-RAB10, treated with DMSO or Val. (1 µM) for 3 h and immunostained for FLAG. Arrows in (a) indicate examples of colocalization of GFP-OPTN and FLAG-RAB10. Scale bars: 10 µm. (b) Quantification of the percentage of cells with colocalization of GFP-OPTN and FLAG-RAB10 (n = 3). § P < 0.005 compared with DMSO. (c,d) Ctrl1 fibroblasts were transfected with GFP-tagged OPTN and either control siRNA or RAB10 siRNA1. After 72 h cells were treated with DMSO of valinomycin (Val., 1 µM) for 3 h. and immunostained for HSPD1. Arrows in (c) indicate examples of colocalization of GFP-OPTN and HSPD1. Scale bars: 10 µm. (d) Quantification of the percentage of cells with colocalization of GFP-OPTN and HSPD1 (n = 3). * P < 0.001 compared with the ctrl siRNA DMSO condition. # P < 0.05 compared with the ctrl siRNA Val. 3 h condition. (e) Control fibroblasts were transfected (Transf.) with empty vector (EV) or FLAG-tagged RAB10, as indicated. After coimmunoprecipitation (Co-IP) with anti-FLAG beads, the immunoprecipitate (IP) and input samples were analyzed by SDS-PAGE and western using the indicated antibodies. (f,g) Fibroblasts were transfected with EV or FLAG-tagged Q68L or T23N RAB10, as indicated. After Co-IP with anti-FLAG beads, the IP and input samples were analyzed by SDS-PAGE and western. (g) Quantification of the ratio of OPTN in the IP over OPTN in the input (n = 3). § P < 0.005 compared with all other conditions. # P < 0.05 compared with EV. (h,i) Ctrl1 and G2019S fibroblasts (h) and Ctrl2 and R1441C fibroblasts (i) were transfected with EV or FLAG-tagged RAB10. In (h) cells were treated or not with MLi-2 (150 nM) for 24 h. After Co-IP with anti-FLAG beads, the IP and input samples were analyzed by SDS-PAGE and western.