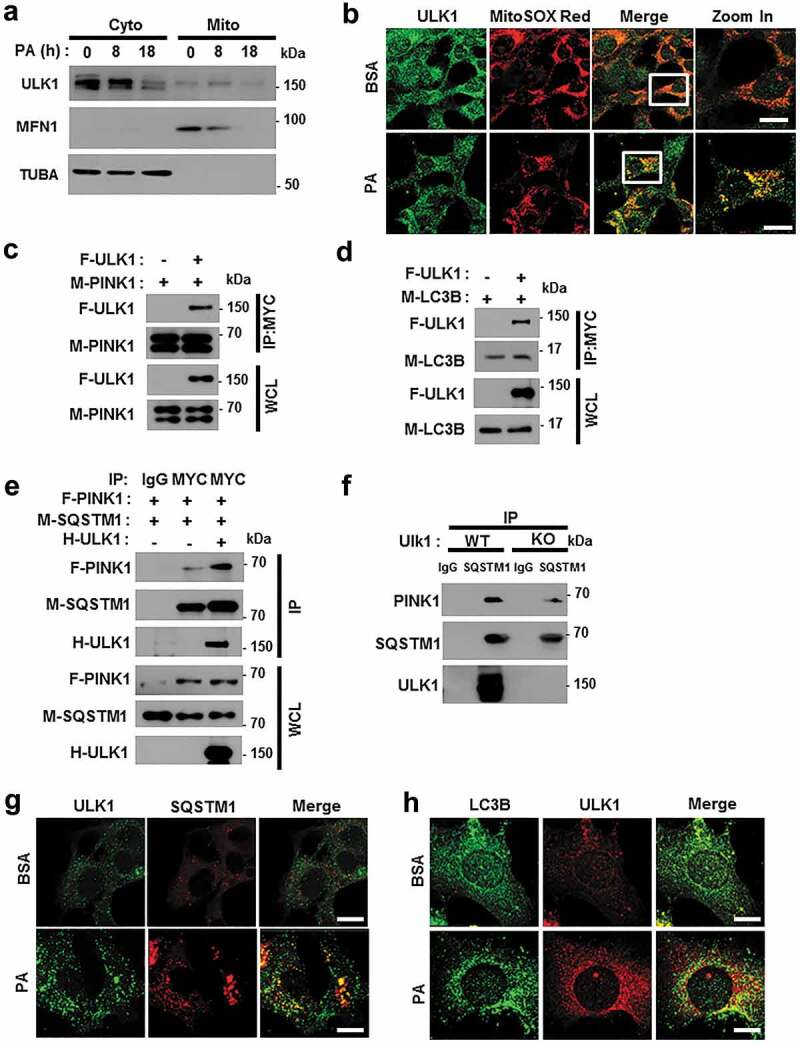
Figure 10.

ULK1 enhances the interaction between SQSTM1 and PINK1. (a) Mitochondrial fractionation analysis of Hepa1c1c7 cells after treatment with PA (500 μM) for the indicated times; samples were subjected to immunoblot analysis using antibodies specific for ULK1, MFN1, and TUBA (loading control). (b) Confocal microscopy analysis of MitoSOX Red and ULK1 staining in Hepa1c1c7 cells after treatment with PA (500 μM) for 18 h. Nuclei were also stained with DAPI, and representative single optical sections and merge images are shown. Scale bars: 10 μm. (c) Lysates of HEK293 cells transfected with MYC-PINK1 and FLAG-ULK1 were subjected to immunoprecipitation using MYC antibodies, and the resulting immunoprecipitation (IPs), as well as the whole cell lysates (WCLs), were subjected to immunoblot analysis with antibodies specific for the indicated proteins. (d) Lysates of HEK293 cells transfected with F-ULK1 and M-LC3B was subjected to IPs with MYC antibodies, and the resulting IPs and WCLs were subjected to immunoblot analysis using antibodies specific for the indicated proteins. (e) Lysates from HEK293 cells transfected with F-PINK, M-SQSTM1, and H-ULK1 were subjected to immunoprecipitation using MYC antibodies, and the resulting IPs and WCLs were subjected to immunoblot analysis with antibodies specific for the indicated proteins. (f) Lysates from Ulk1 WT or ulk1 KO MEF cells were subjected to immunoprecipitation with antibodies for SQSTM1, and the resulting IPs and WCLs were subjected to immunoblot analysis using antibodies specific for the indicated proteins. (g) Confocal microscopy analysis of SQSTM1 and ULK1 colocalization. Scale bar: 5 μm. (h) Confocal microscopy analysis of colocalization of LC3B and ULK1 in Hepa1c1c7 cells co-transfected with vectors encoding M-LC3B and H-ULK1. Scale bar: 5 μm. Data are presented as the mean ± SD from three independent experiments.
