
Figure 2.
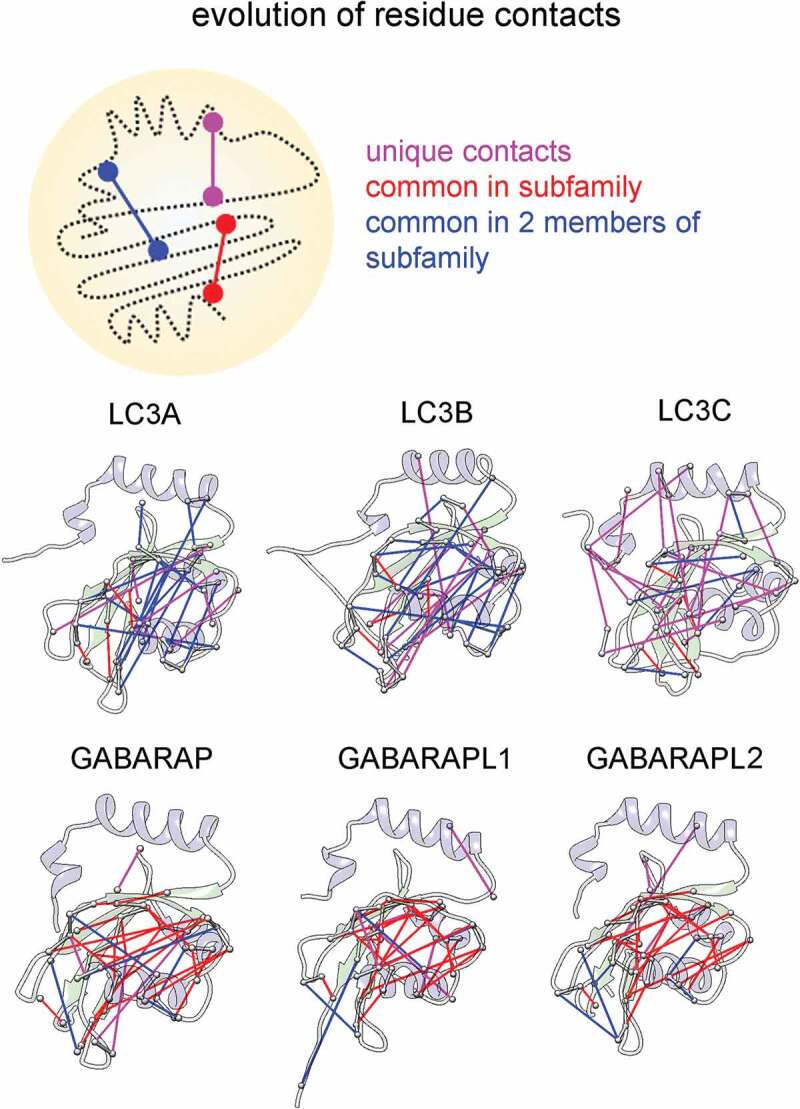
Co-evolution differentiating the broad LC3 and GABARAP subfamilies. Schematic diagram showing comparison of co-evolved contacts within subfamilies (top). We compared and mapped the top 30 co-evolved residue pairs onto the structures of all HsAtg8 orthologs and classified them as unique contacts (present only in individual member of subfamily), common in all members of subfamily and common only in 2 members of subfamily. The three categories are marked in magenta, red and blue, respectively.