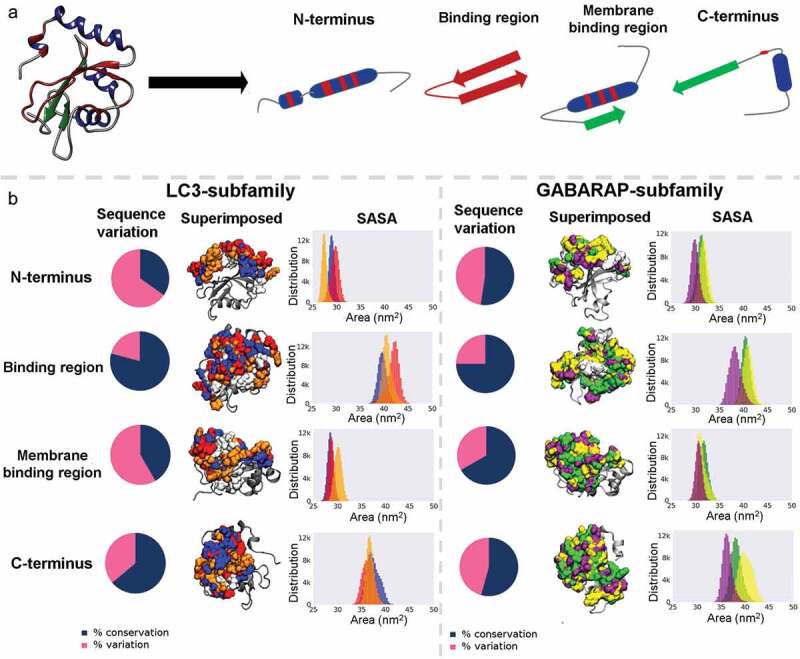
Figure 3.

Residue based microclusters differentiate termini uniquely. (a) Schematic representation of four microclusters (functional modules) i.e., N-terminus, binding region, membrane binding region, and the C-terminus. The helices and sheets are colored in blue and green, respectively and the binding region is shown in maroon color. (b) Analysis of surface accessible surface area in LC3 and GABARAP subfamilies is shown. The first column shows pie chart illustrating sequence variation in percentage for each microcluster, with percentage of conserved and varied residues shown in blue and pink, respectively. The protein snapshots shows the superimposed molecular surface of three subfamily members where LC3A, LC3B, LC3C, GABARAP, GABARAPL1 and GABARAPL2/GATE16 proteins are colored in blue, red, orange, green, yellow and purple, respectively. The common surface in each microcluster is shown in white color. The last column shows the distribution of accessible surface area calculated from MD simulations and the color legends in the histograms refer to the same protein, as explained above.
