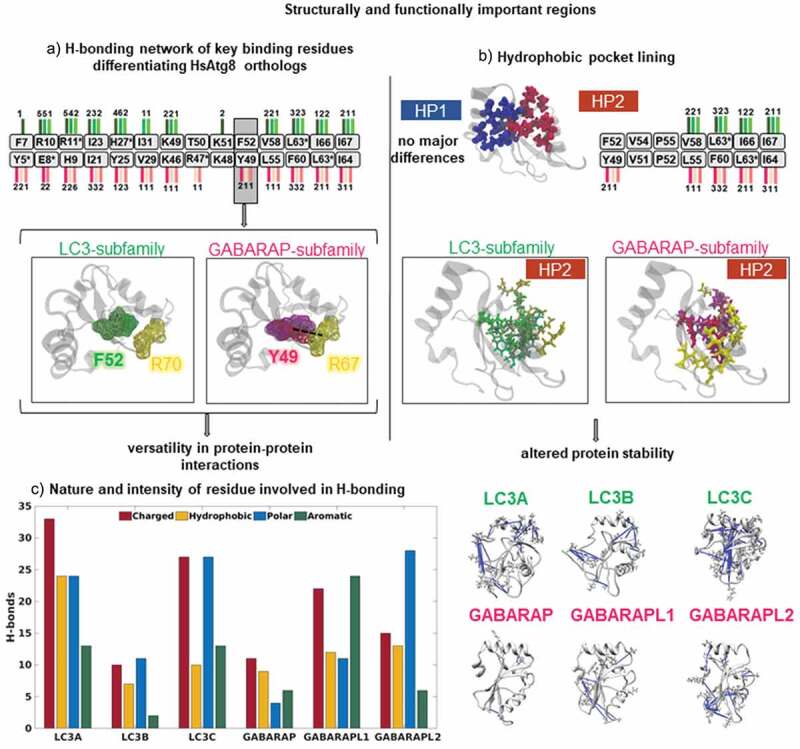
Figure 4.

Hydrogen bonding network revealed differences in functionally important regions. (a) Hydrogen bonding pattern showing the key binding residues (in boxes) distinguishing LC3 and GABARAP subfamilies. The number of hydrogen bonds in LC3 and GABARAP subfamily are marked by lines colored in green and pink shades, respectively. The snapshot represents differences in the critical binding residue (F52/Y49) in LC3 and GABARAP subfamily. The dotted line represents distinct hydrogen bond with R67 in the GABARAP subfamily, however, the bond is absent in LC3 subfamily. (b) Differences in residues lining the hydrophobic pockets (HP1 and HP2), colored in blue and maroon, respectively. We observed no major differences in HP1. The number of hydrogen bonds in HP2 contacts shown in LC3 (green) and GABARAP (pink) subfamily markedly differ. The snapshot displays the hydrogen bonds of HP2 in both subfamilies, where the interacting residues are colored in yellow. (c) Bar plot showing number of unique H-bonds formed by polar, charged, aromatic and hydrophobic residues in each HsAtg8 ortholog. In addition, the snapshots highlight the distribution of polar residues involved in hydrogen bonds (in blue) in each protein structure.
