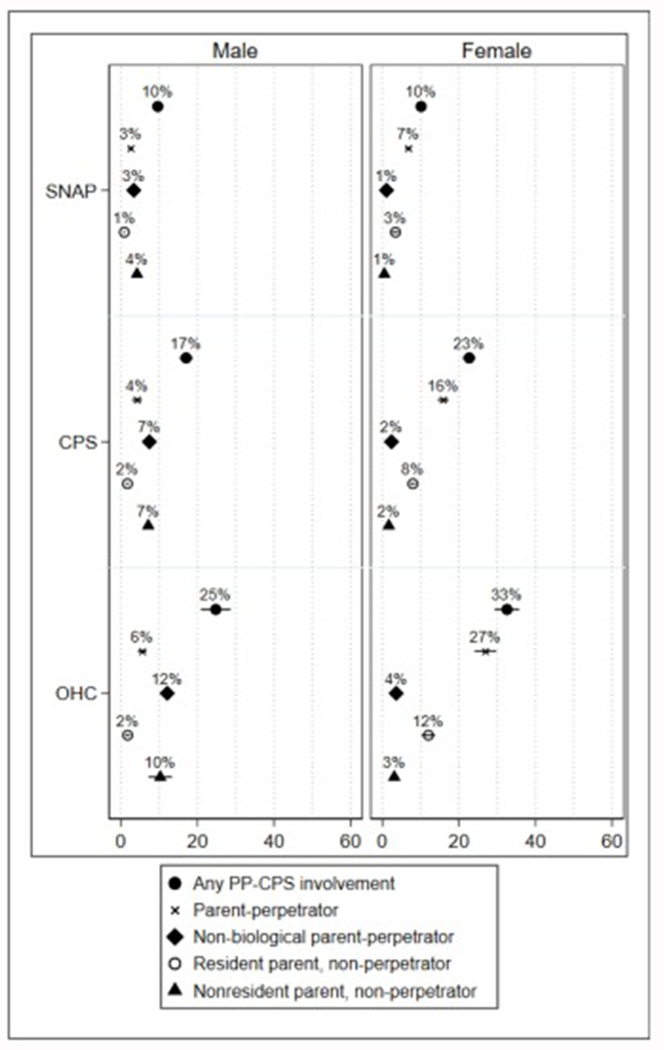
Fig. 2. Estimated rates of each type of parent or perpetrator CPS involvement (PP-CPS) by sex and sample group (full sample).
Graph depicts predicted proportions (expressed as percentages) and 95 % confidence intervals produced from sex subgroup logistic regression models that included group, race, year of birth, childhood Supplemental Security Income receipt, and percent of childhood (ages 0–16) receiving SNAP benefits.

