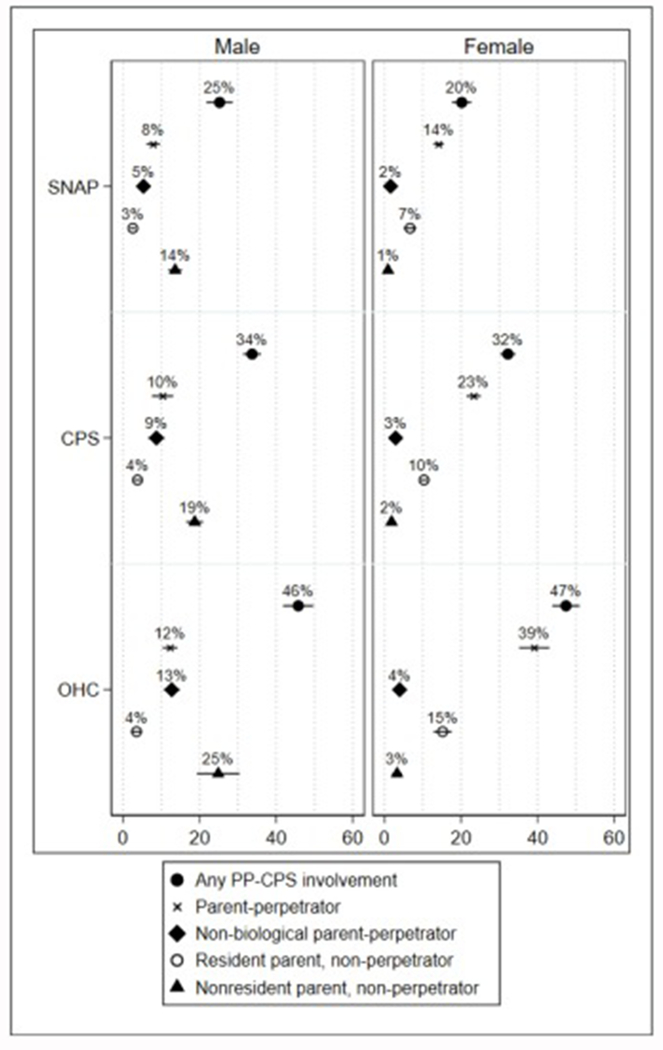
Fig. 3. Estimated rates of parent and perpetrator CPS involvement (PP-CPS) by sex and sample group among individuals with biological children.
Graph depicts predicted proportions (expressed as percentages) and 95 % confidence intervals produced from sex-subgroup logistic regression models that included the following predictors: group, age at first child, race, year of birth, childhood Supplemental Security Income receipt, and percent of childhood (ages 0–16) receiving SNAP benefits. Predicted probabilities hold all controls constant except group. Sample is limited to individuals known to have one or more biological children.

