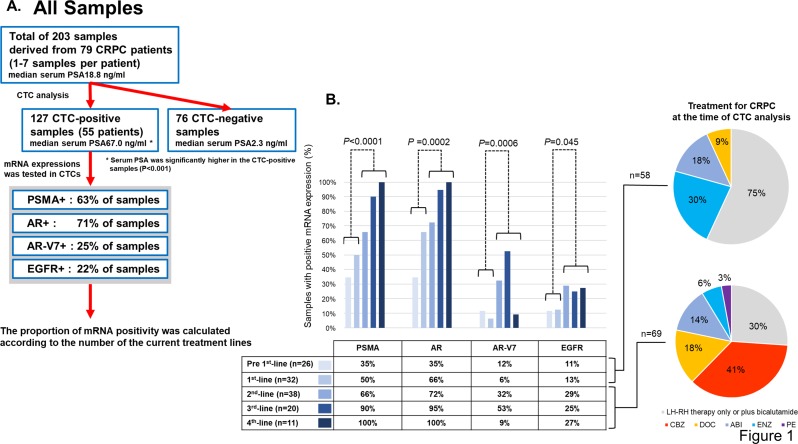
Fig 1. Comprehensive analysis of all samples and mRNA expressions at a different treatment phase.
A. A flowchart for all samples’ analysis. The number of CTC detection and mRNA positivity are indicated in the box. Out of 203 CTC samples in total, 127 of them were positive for CTCs. B. 127 CTC-positive samples were classified according to the number of treatment when each sample was taken. Treatment lines were divided into two groups: pre 1st-line/1st-line or 2nd-line/more. The proportions of positive mRNA expressions were compared between these two groups by the Fisher’s exact test. PSMA, AR, AR-V7, and EGFR were significantly more expressed in 2nd-line/more group (P<0.05).

