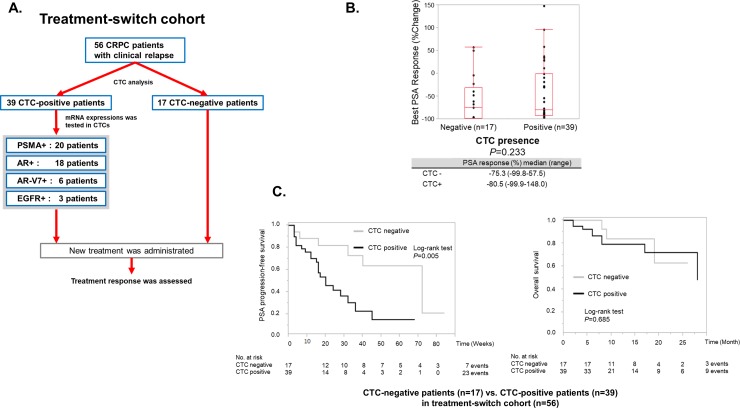
Fig 2. Overview of a treatment-switch cohort and the association between CTC presence and treatment response.
A. A flowchart for the “Treatment-switch cohort”. This cohort includes 56 patients who had their CTC samples collected at the time of recurrence and were given new treatments thereafter. The number of CTC detection and mRNA positivity are indicated in the box. B. The Wilcoxon Mann-Whitney test was used to assess the association between the best PSA response or the percentage of change in PSA and CTC presence. The presence of CTCs was not significantly correlated with the percentage of change in PSA (median change: -75.3% vs -80.5%, P = 0.233). C. The Kaplan-Meier plot of PSA-PFS and Overall survival was drawn based on CTC presence. The differences were compared with the log-rank test. The median PSA-PFS was 20 weeks (95% CI, 15 to 32) for the CTC-positive cohort, while it was 72 weeks (95% CI, 32 to -) for the negative cohort. PSA-PFS was significantly shorter in the CTC-positive cohort by the log-rank test (P = 0.005). The median Overall survival was 28 months (95% CI, 17 to -) for the CTC-positive cohort, while it was not reached (95% CI, 9 to -) for the negative cohort. Overall survival was not significantly shorter in the CTC-positive cohort by the log-rank test (P = 0.685).

