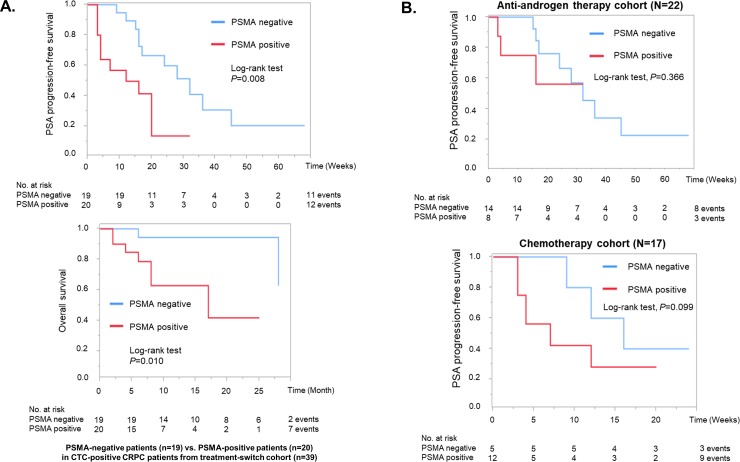
Fig 5. PSA-PFS and overall survival according to the PSMA expression in CTCs.
A. The Kaplan-Meier plots of PSA-PFS and overall survival were drawn according to the PSMA status in CTCs. The differences were compared with the log-rank test. B. The Kaplan-Meier plots of PSA-PFS were plotted according to the PSMA status in anti-androgen therapy and chemotherapy cohort respectively.

