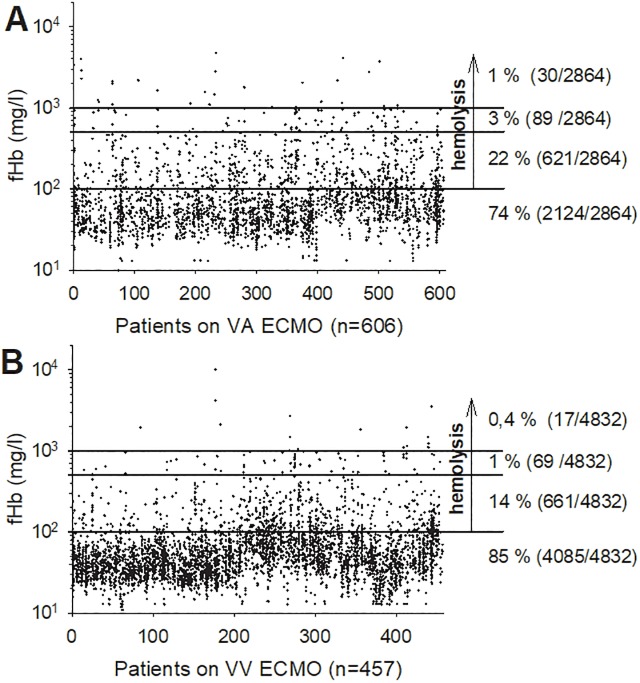
Fig 2. All fHb measurements from 1st day till end of VA- or VV ECMO support (A: VA n = 606, B: VV n = 457).
The lines divide the graph into values ≤ 100 mg/l (102), 101–500 mg/l, 501–1000 mg/l and > 1,000 mg/l (103) which indicates a rising degree of hemolysis. The arrow shows all fHb above 100 mg/l that are suspected of hemolysis: 26% (VA) vs. 15% (VV). Of particular importance were fHb values above 500 mg/l as critical hemolysis markers [2,9]: 1% (VA) vs. 0.4% (VV).

