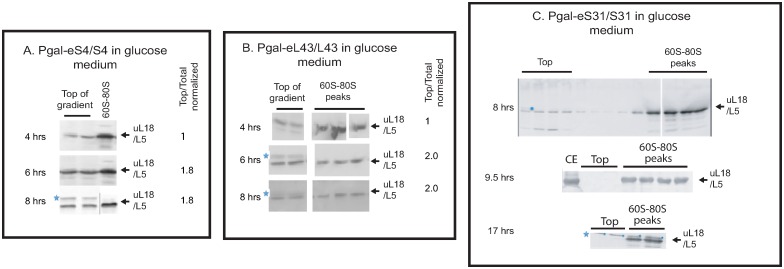
Fig 4. Extra-ribosomal uL18 as a function of time after repressing eS4, eL43, and eS31.
Pgal-eS4, -eL43 and -eS31 were grown in galactose medium and shifted to glucose medium. At the indicated times after the shift, extra-ribosomal uL18 was quantified. (A) Pgal-eS4 and (B) Pgal-eL43. Consecutive fractions from the top and the 60S-80S region of the gradient were analyzed. The blots were scanned and quantified using Photoshop CC 2019. The ratio of uL18 found in the top fractions relative to uL18 in all fractions on the western blot was calculated for each time point and normalized to the value for the 4-hour sample. (C) Pgal-eS31. All fractions from the top of the sucrose gradient through the polysome region are shown for the 8-hour sample. For the 9.5 and 17-hr samples, consecutive fractions from the top and the 60S-80S region of the sucrose gradient are shown. See S3 Fig for uncropped blots. CE cell extract.

