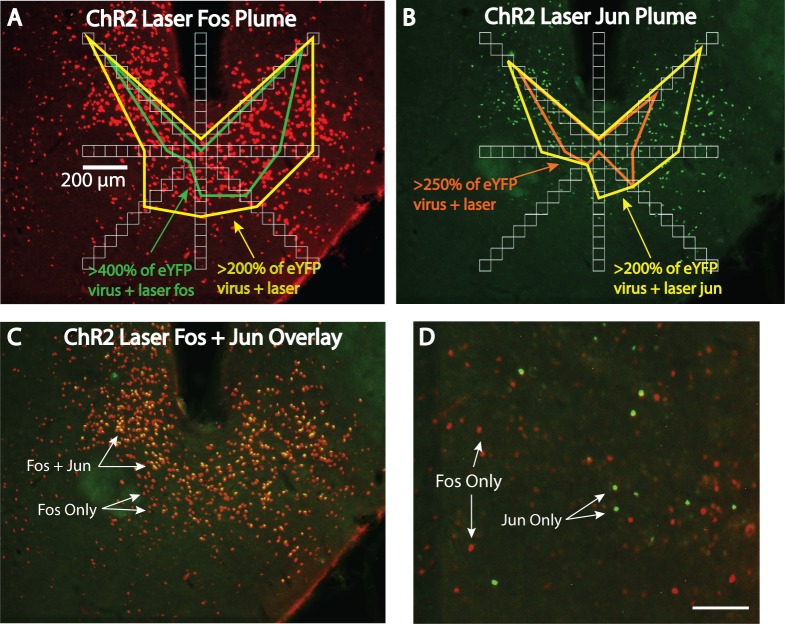
Fig 3. Fos and Jun plume measurement process.
A: Fos plume from Fig 2 overlaid with an eight radial arm set of boxes for neuronal counting. Yellow and orange outlines represent elevation in neuronal Fos expression in ChR2 brains versus eYFP brains after both receive similar laser illumination. B: Jun plume from the same brain section. C: Overlap of Fos (red) and Jun (green) expression in the same brain. Optogenetic Jun plumes overlap almost exclusively within Fos plumes. D: Photomicrograph from the same brain section but in the dorsomedial hypothalamus, showing non-overlapping Fos and Jun expression. Scale bars represent 100 μm unless otherwise stated.

