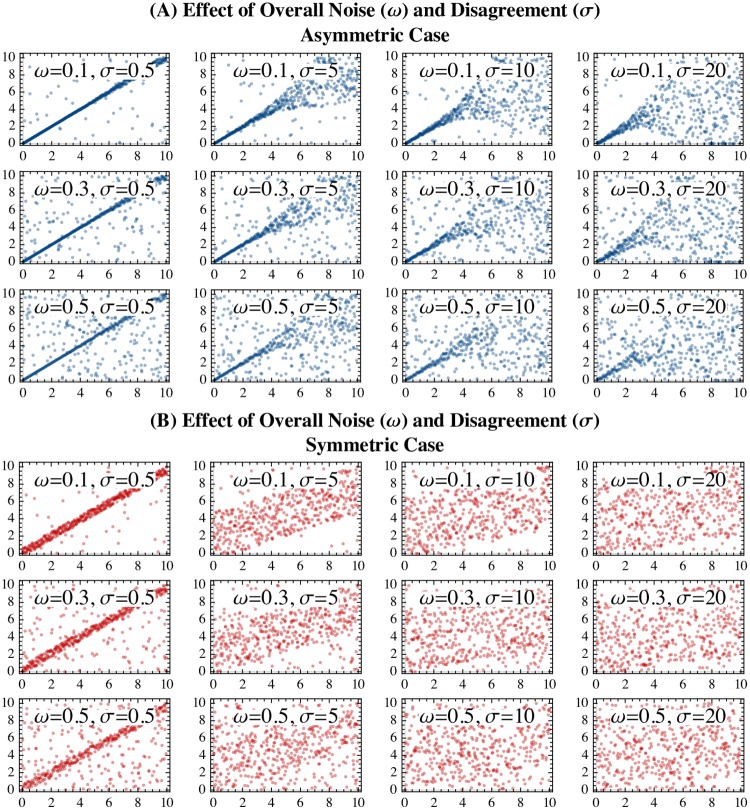
Fig 1. Demonstration of the synthetic agreement data across differences in the parameter ranges and presence of asymmetry.
The x-axes all represent the ground truth value of the variable, and the y-axes represent the “observed” values. Data are depicted based on different values of a uniform noise parameter (0 ≤ ω ≤ 1) that governs what proportion of the data is merely uniform noise over the interval [0, 10], and a disagreement parameter (σ ≥ 0), which governs the variance around the diagonal line. Panel A (upper three rows, shown in blue) depicts the synthetic data in which there was asymmetrical levels of agreement across the score domain. Panel B (lower three rows, shown in red) depict synthetic data in which there was symmetrical agreement over the score domain.

