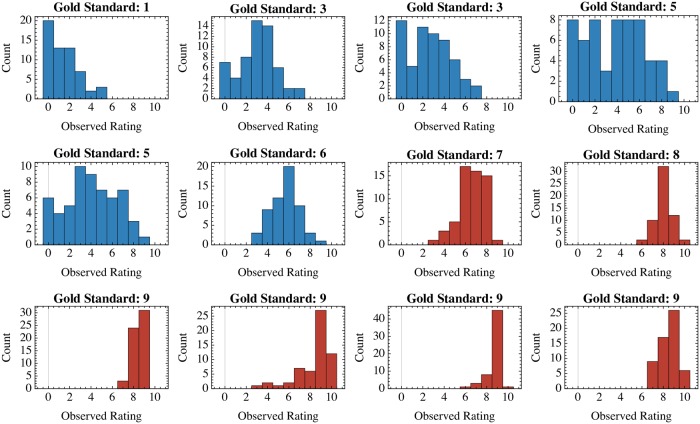
Fig 2. Histograms of ratings for each value of the ground truth Alda score available in the first wave dataset from Manchia et al. [1].
Each histogram represents the distribution of ratings (nr = 59) for a single one of twelve assessment vignettes. The gold standard (“ground truth”) Alda score, obtained by the Halifax consensus sample, is depicted as the title for each histogram. Plots in blue are those for vignettes with gold standard Alda scores less than 7, which would be classified as “non-responders” under the dichotomized setting. Vignettes with gold standard Alda scores ≥ 7 are shown in red, and represent the dichotomized group of lithium responders.

