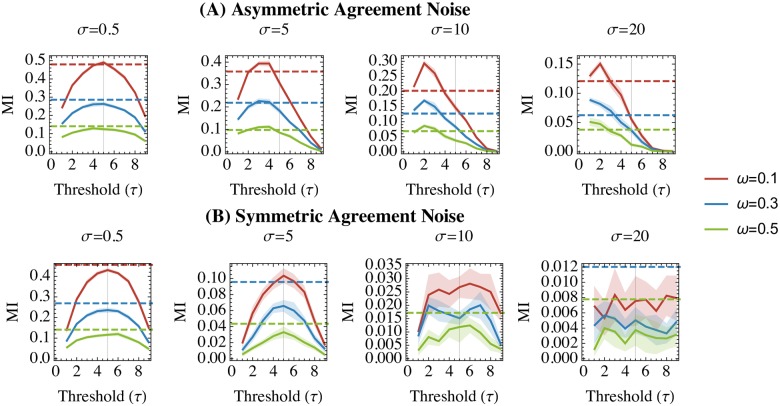
Fig 4. Mutual information (MI) for dichotomized (solid lines) and continuous (dashed lines) distributions on synthetic data with asymmetrical (upper row, Panel A) and symmetrical (lower row, Panel B) properties with respect to agreement.
X-axes represent the dichotomization thresholds at which we recalculate the dichotomized MI. Mutual information is depicted on the y-axes. Plot titles indicate the different diagonal spread (σ) parameters used to synthesize the synthetic datasets. Solid lines (for dichotomized MI) are surrounded by ribbons depicting the 95% confidence intervals over 10 runs at each combination of parameters (τ, ω, β, σ).

