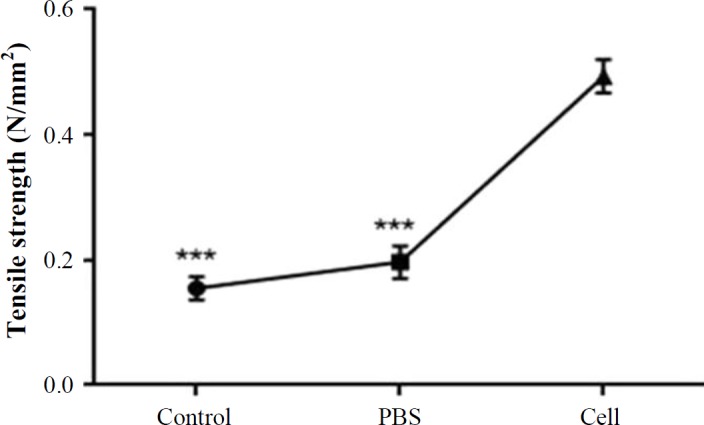
Fig 10.

Tensile strength analysis of burn wound samples of HFSCs, PBS, and control group on day 14 post burn (n = 6; analysis of variance; mean ± SD, ***p < 0.001).

Tensile strength analysis of burn wound samples of HFSCs, PBS, and control group on day 14 post burn (n = 6; analysis of variance; mean ± SD, ***p < 0.001).