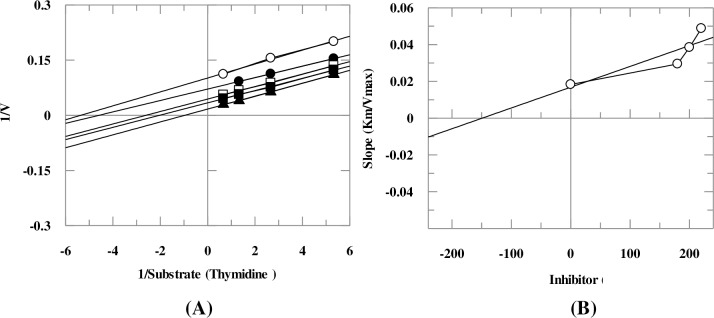
Fig 5.
Kinetic mode of compound 27 (A) Depicts Lineweaver-Burk plot of compound 27 in which reciprocal of substrate concentration (1/S) is plotted on x-axis, while reciprocal of rate of reaction (1/V) is plotted on y-axis in the absence and present of different concentrations of compound 27. (B) Depicts secondary re-plot of Lineweaver-Burk plot between the slopes (Km/Vmax) of each line versus different concentrations of compound 27.

