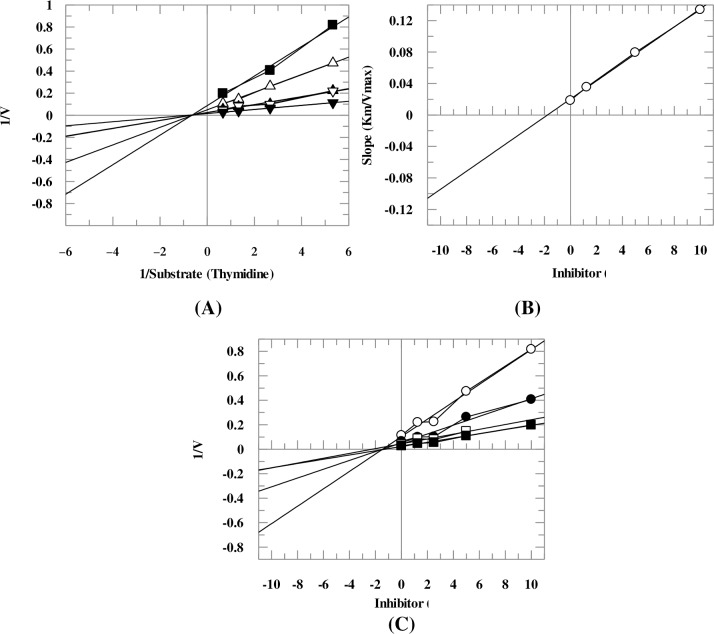
Fig 6.
Kinetic mode of compound 22 (A) Depicts Lineweaver-burk plot of compound 22 in which reciprocal of substrate concentration (1/S) is plotted on x-axis, while reciprocal of rate of reaction (1/V) is plotted on y-axis in the absence and presence of different concentrations of compound 22. Figure shows that apparent km of the enzyme remains unaffected while the apparent Vmax decreased. (B) Depicts secondary re-plot of Lineweaver-Burk plot between the slopes (Km/Vmax) of each line versus different concentrations of compound 22. (C) Depicts Dixon plot of reciprocal of rate of reaction (velocities) versus different concentrations of compound 22.

