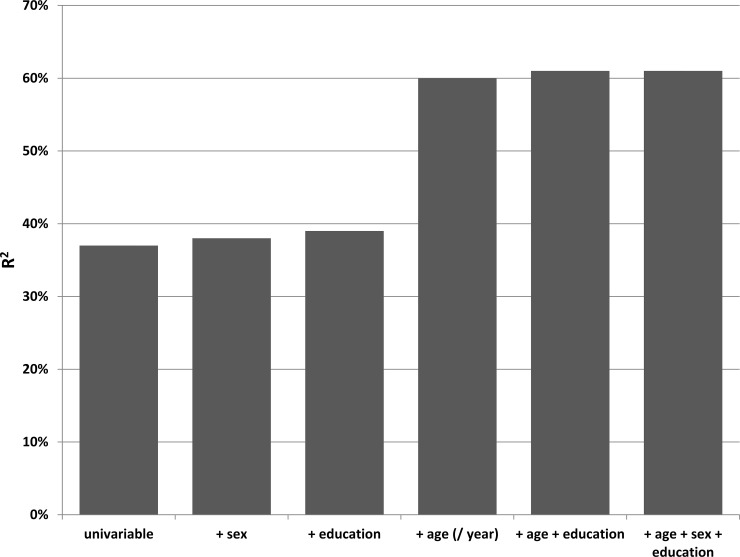
Fig 2. Results from the linear regression analysis for the question: ‘Do you have any difficulty with your hearing?’.
First univariable analysis was done, then each of the independent covariates were added, initially separately and later together. R2 is given as a measure of the goodness of fit of the model.

