Figure 2.

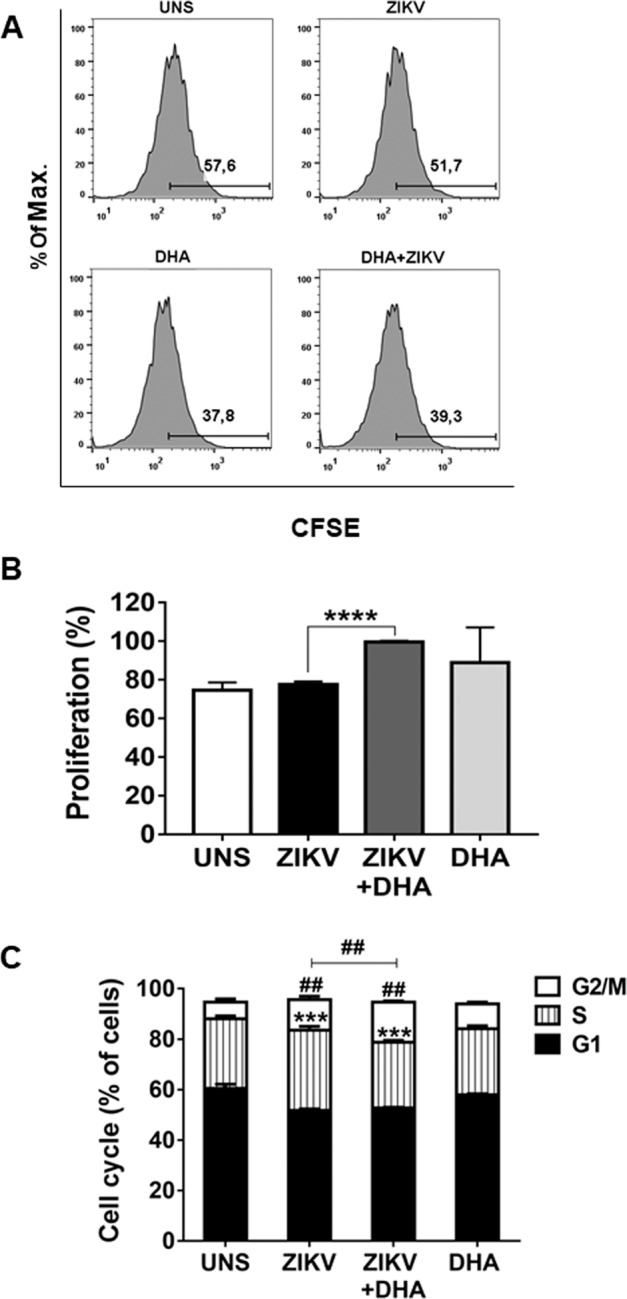
SH-SY5Y cells were pre-treated (or not) with DHA before ZIKV infection (MOI 10). After 96 hours, cell proliferation was assessed by Carboxyfluorescein Succinimidyl Ester (CFSE) staining and analyzed by flow cytometry. (A) Histograms are representatives of three independent experiments and were made using FlowJo Version 9. A quantitative graph of CFSE was also performed using data from three independent experiments. (B) Here, asterisks represent statistical significance with p < 0.001 (****). Additionally, SH-SY5Y cells were pre-treated (or not) with DHA (12,5 μM) before ZIKV infection (MOI 10) and after 72 hours, cell cycle was assessed by Propidium Iodide staining and analyzed by flow cytometry. (C) Flow cytometry data were plotted in the graph using GraphPad Prism. All experiments here were performed in triplicate, each being repeated at least three times independently. Here, symbols represent statistical significance comparing the untreated ZIKV infected cells with DHA-treated ZIKV infected cells in the G2/M phase (##p ≤ 0.001) or in the S phase (***p ≤ 0.01).
