Figure 1.

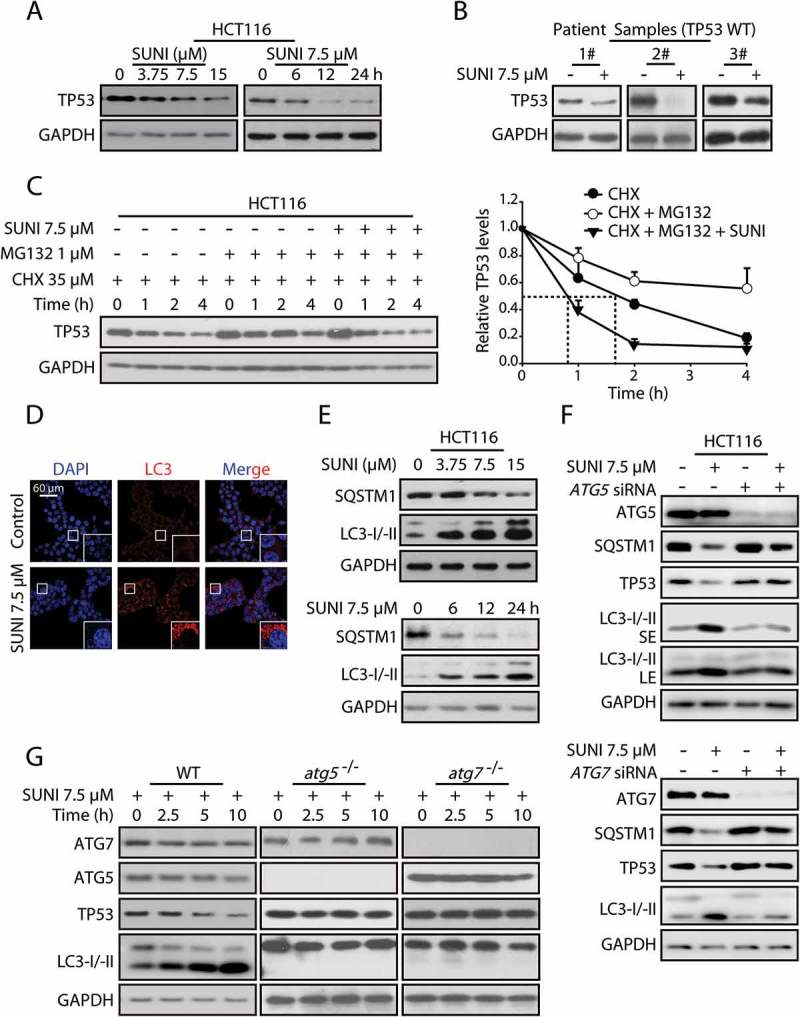
Sunitinib accelerates the degradation of TP53 protein via the autophagy-lysosome pathway. (a) Representative western blots show TP53 expression in untreated and sunitinib-treated HCT116 cells. The cells were treated for 6, 12 or 24 h with 7.5 µM sunitinib or for 24 h with 3.75, 7.5 or 15 µM sunitinib. (b) Representative western blots show TP53 expression in untreated and sunitinib-treated primary colon cancer cells. (c) HCT116 cells were treated with 35 µM CHX and 1 µM MG132 in the presence or absence of 7.5 µM sunitinib for different times, and TP53 protein levels were measured by western blot analysis (left panel). The half-life of TP53 was detected. The TP53 expression levels from biological triplicates were normalized with GAPDH and quantified with Quantity One. The data represent the average of 3 independent experiments (right panel). (d) Immunocytochemistry for LC3 and nuclear staining with DAPI in HCT116 cells treated with 7.5 µM sunitinib for 24 h. Scale bar: 60 μm. (e) Representative western blots show LC3 and SQSTM1 expression in the same cells as in (a). (f) Representative western blots show the effect of knockdowns of ATG5 and ATG7 on the sunitinib-induced degradation of TP53 in HCT116 cells. (g) Representative western blots show TP53 expression in untreated and sunitinib-treated WT, atg5−/− and atg7−/− MEFs. SUNI, sunitinib; CHX, cycloheximide; SE, short exposure time; LE, long exposure time. All experiments were performed in triplicate. For western blots, the data from 1 of 3 similar experiments are shown.
