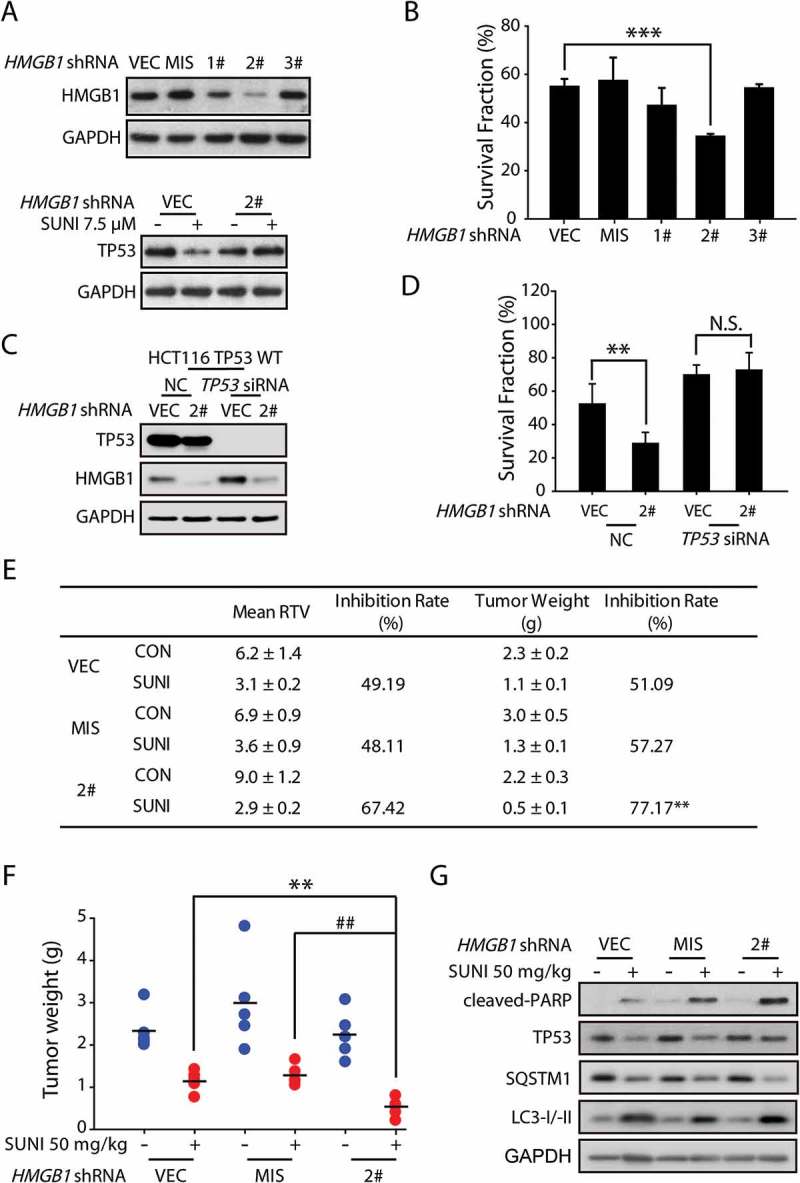
Figure 6.

HMGB1 inhibition increases the anti-cancer activity of sunitinib by rescuing TP53 expression. (a) Representative western blots show the effect of HMGB1 knockdown on sunitinib-induced degradation of TP53 in HCT116 cells. The cells were treated with sunitinib for 24 h. (b) Results from the SRB staining assay show the effect of HMGB1 knockdown on the anti-cancer activity of sunitinib in HCT116 cells. The data are representative of 3 independent experiments. The data are expressed as the mean ± SD and P-values were determined using an unpaired two-tailed Student’s t-test (***P = 0.0002, HMGB1 shRNA2# versus vector). (c) Representative western blots show the efficiency of the HMGB1 and TP53 knockdown in HCT116 TP53 WT cells. (d) Results from the SRB staining assay show the effect of the HMGB1 and TP53 knockdown on the anti-cancer activity of sunitinib in HCT116 TP53 WT cells. The data are expressed as the mean ± SD and the P-values were determined using an unpaired two-tailed Student’s t-test (**P = 0.002, sunitinib versus control; N.S. = 0.26, HMGB1 shRNA versus vector). (e-g) Nude mice transplanted with HCT116 cells transfected with the vector (VEC), mismatched (MIS) or stable knockdown for HMGB1 were randomly divided into 2 groups (n = 5/group) and were treated with either the vehicle or sunitinib (50 mg/kg once a day). (e) The mean RTV values, inhibition rate of RTV, mean tumor weight and inhibition rate of tumor weights are shown. The mean RTV and mean tumor weight are expressed as the mean ± SEM. A one-way ANOVA followed by a post hoc Tukey’s test was used to identify significant differences (**P = 0.004, HMGB1 shRNA2# versus vector). (f) The dots represent the tumor weights of each of the tumors in 6 groups and the lines represent the mean values from each group. The data are expressed as the mean ± SEM. A one-way ANOVA followed by a post hoc Tukey’s test was used to identify significant differences (**P = 0.004, HMGB1 shRNA2# versus vector; ##P = 0.001, HMGB1 shRNA2# versus mismatched shRNA). (g) Representative western blots show the expression levels of cleaved-PARP and TP53 in each tumor group. SUNI, sunitinib. Three independent in vitro experiments were performed. For western blots, the data from 1 of 3 experiments are shown.
