
Figure 1.
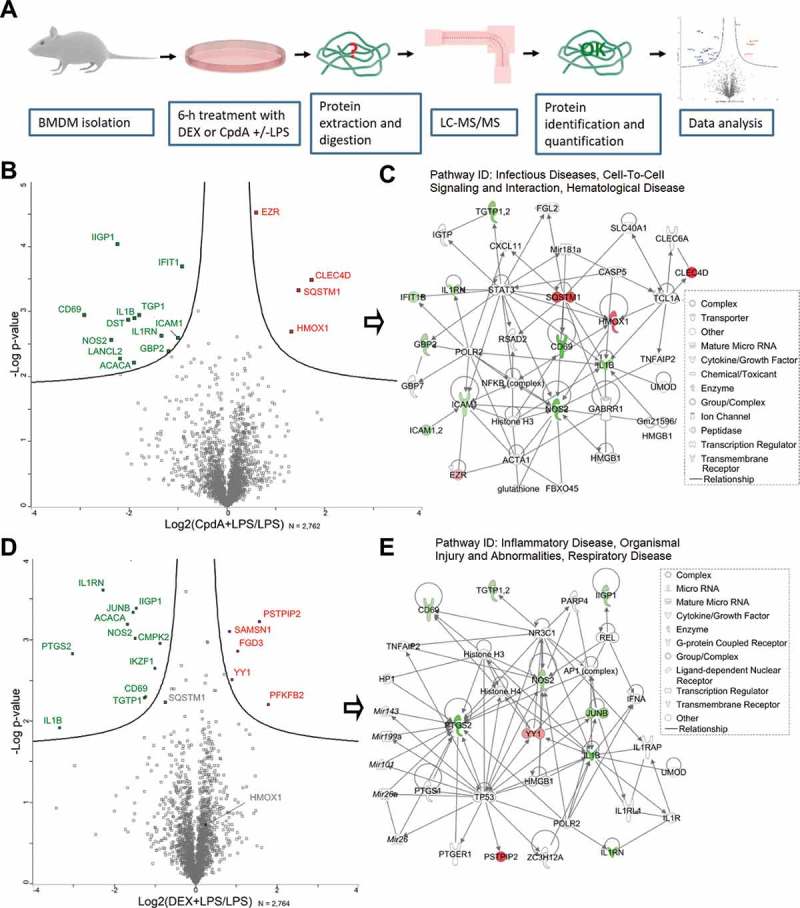
LC-MS/MS analysis reveals differentially expressed proteins in BMD macrophages treated with DEX or CpdA under the inflammatory condition. (A) Schematic overview of the mass spectrometry-based shotgun proteomics experiment. (B) Volcano plot with significantly up- (red) or downregulated (green) proteins in CpdA + LPS versus LPS alone. CpdA (10 μM) and 100 ng/ml LPS treatments were used. Statistics by multiple two-sample t-tests, each with a permutation-based FDR of 0.05 and S0 value of 0.1 for truncation. (N = 3). (C) Ingenuity pathway analysis (www.qiagenbioinformatics.com) of significantly regulated proteins from CpdA+ LPS versus LPS comparison. (D) Volcano plot with significantly up- (red) or downregulated (green) proteins in DEX + LPS versus LPS. DEX (1 μM) and 100 ng/ml LPS treatments were used. Statistics by multiple two-sample t-tests, each with a permutation-based FDR of 0.05 and S0 value of 0.1 for truncation. (N = 3). (E) Ingenuity pathway analysis of significantly regulated proteins from DEX+ LPS versus LPS comparison.