
Figure 4.
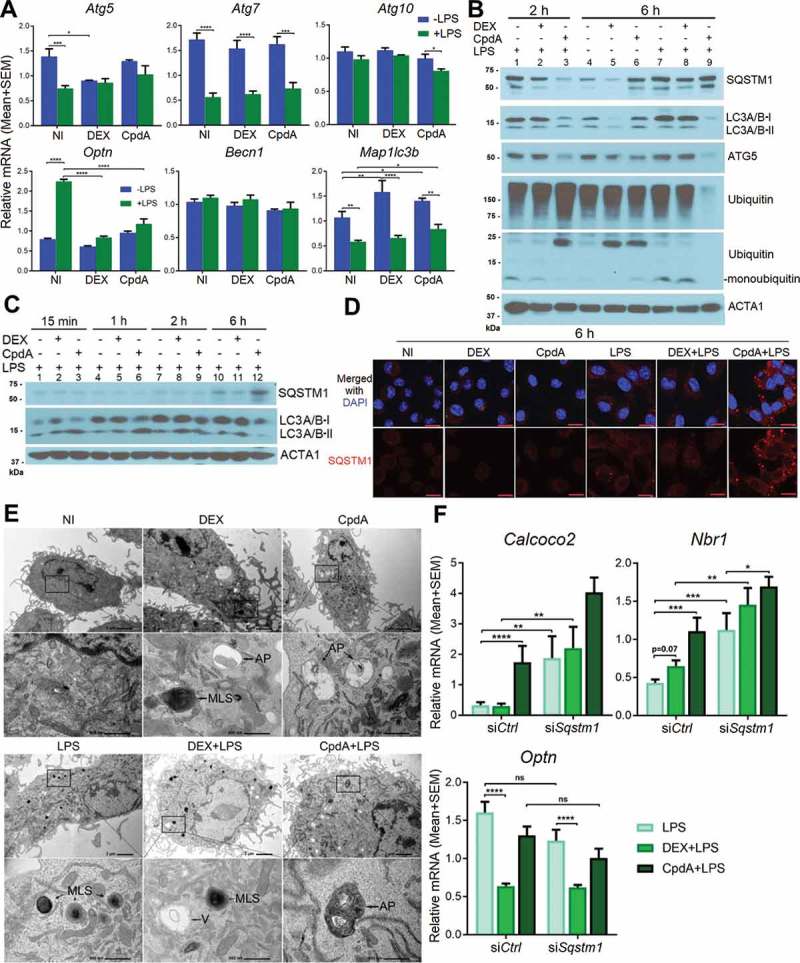
DEX and CpdA induce autophagy in macrophages. (A) qPCR analysis of BMDM treated with vehicle, 1 μM DEX, 10 μM CpdA and 100 ng/ml LPS for 6 h. Gene expression levels were normalized to Ppia/cyclophilin and Gapdh using qbase+ . Statistical analysis was done using two-way ANOVA and Dunnett’s test (*p < 0.05, **p < 0.01, ***p < 0.001, ****p < 0.0001, N = 4). NI, non-induced. (B, C) Immunoblotting of BMDM treated with 1 μM DEX, 10 μM CpdA and 100 ng/ml LPS for 15 min, 1 h, 2 h and 6 h. ACTA1/actin served as a loading control. kDa, kilodaltons. (D) Representative SQSTM1 (red) imaging in BMDM cells after 6-h treatment with vehicle, 1 μM DEX, 10 μM CpdA and 100 ng/ml LPS (scale bar: 10 μm). (E) Ultrastructural investigation of BMDM by TEM after 2-h treatment with 1 μM DEX, 10 μM CpdA and 100 ng/ml LPS. Autophagic phenotypes upon DEX treatment were characterized by the presence of myelin-like structures and autophagosomes. Autophagic phenotypes upon CpdA treatment were characterized by a strong vacuolization and presence of autophagosomes. V, vacuoles; MLS, myelin-like structures; AP, autophagosomes. (F) qPCR analysis of BMDMs treated with 1 μM DEX, 10 μM CpdA and 100 ng/ml LPS for 6 h after Sqstm1 was knocked down for 50 h. Statistical analysis was done using two-way ANOVA and Dunnett’s test (*p < 0.05, **p < 0.01, ***p < 0.001, ****p < 0.0001, N = 6). .