Figure 2.

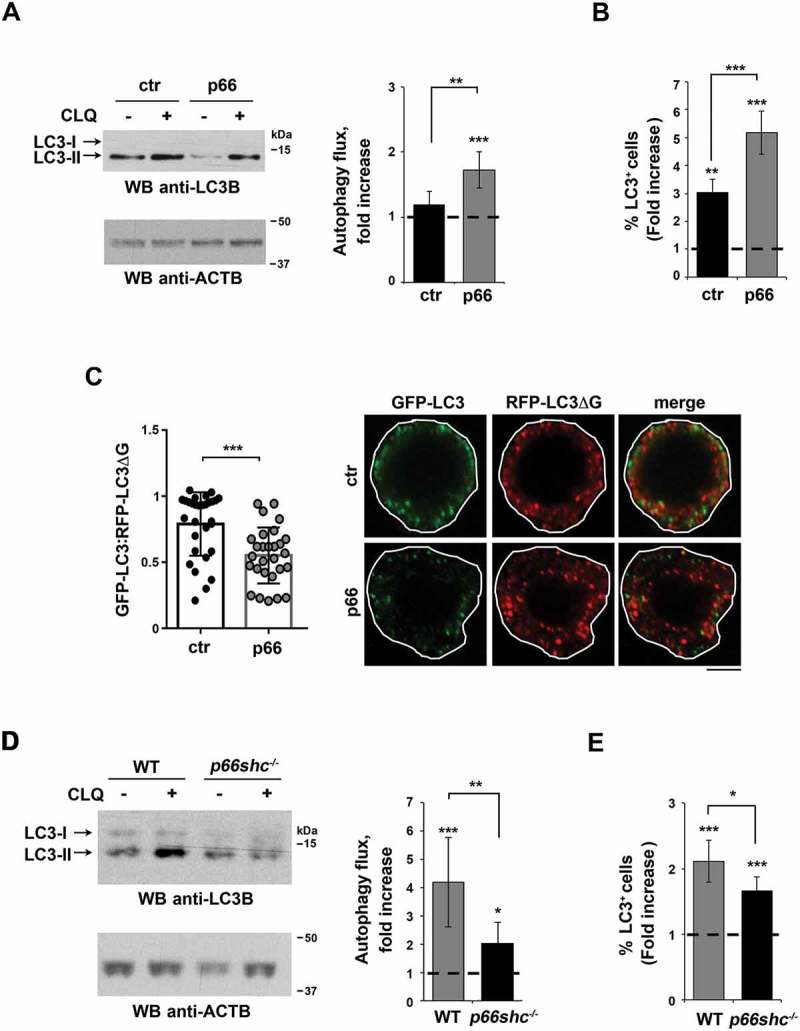
p66SHC promotes B cell autophagy. (A) Immunoblot analysis of the autophagy marker LC3B in lysates of ctr and p66 cells untreated or treated for 1 h with a downstream inhibitor of the autophagy pathway, chloroquine (CLQ). ACTB was used as loading control. The histogram shows the quantification of autophagy flux [80] as the difference in LC3-II:ACTB between CLQ-treated and untreated cells (mean fold ± SD accumulation of LC3B-II in samples treated with CLQ compared to the vehicle control; vehicle control value = 1, dashed line; see also the Methods section) (n ≥ 3). (B) Flow cytometric analysis of LC3-FITC staining of the ctr and p66 cells untreated or treated for 1 h with the commercial lysosome inhibitor ‘Autophagy Reagent A’ (CLQ) (n ≥ 3). The histogram shows the mean fold accumulation of LC3+ cells treated with the ‘Autophagy Reagent A’ compared to the vehicle control (vehicle control value = 1, dashed line). (C) Left, quantification of the ratio between the fluorescence intensity of GFP-LC3 and RFP-LC3ΔG in ctr and p66 cells transiently transfected with the pMRX-IP-GFP-LC3-RFP-LC3ΔG construct and labeled with anti-GFP and anti-RFP antibodies (≥ 10 cells/sample, n = 3). Right, representative images (medial optical sections) are shown. Size bar: 5 μm. (D) Immunoblot analysis of LC3B in lysates of splenic B cells from WT and p66shc-/- mice treated with or without CLQ. ACTB was used as a loading control. The histogram shows the quantification of autophagy flux as the difference in LC3-II:ACTB between CLQ-treated and untreated cells (mean fold ± SD accumulation of LC3B-II in samples treated with CLQ compared to the vehicle control; vehicle control value = 1, dashed line) (n ≥ 10 mice/group). (E) Flow cytometric analysis of LC3-FITC staining of splenic B cells from WT and p66shc-/- mice (≥ 2 mice/exp, n ≥ 3). Cells were either untreated or treated for 1 h with the lysosome inhibitor ‘Autophagy Reagent A’ (CLQ) (n ≥ 3). The histogram shows the mean fold accumulation of LC3+ cells compared to the vehicle control (vehicle control value = 1, dashed line). The asterisks above each graph column indicate the statistical significance compared to the vehicle control. The data are expressed as mean± SD. ***P ≤ 0.001; **P ≤ 0.01; *P ≤ 0.05 (Student’s t-test).
