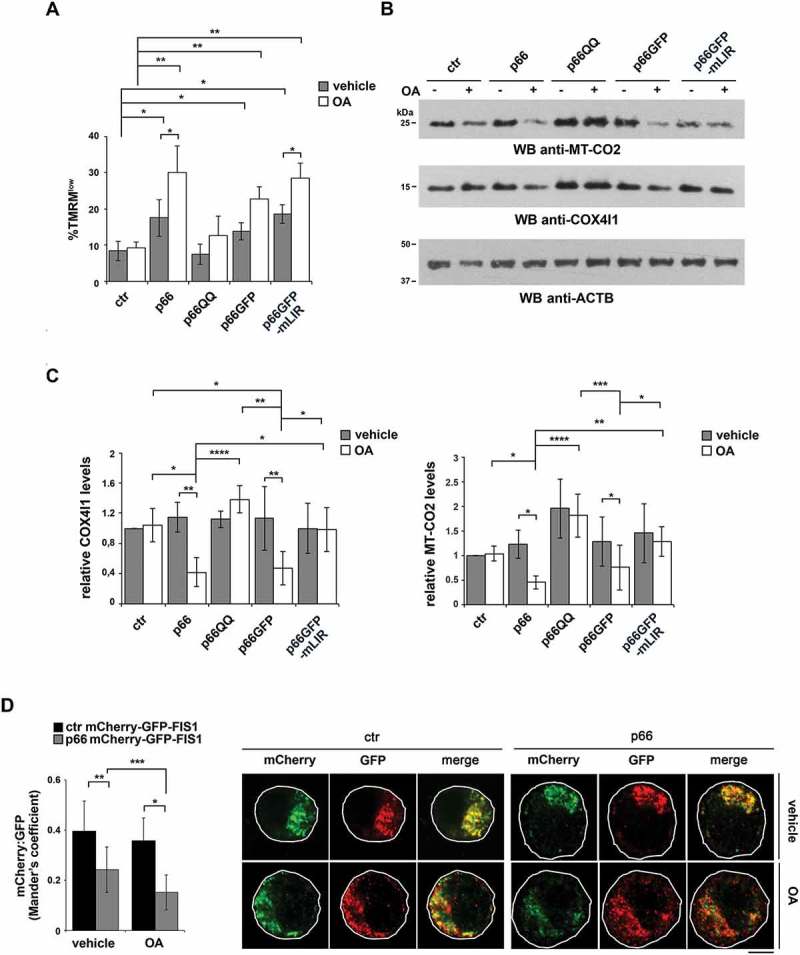
Figure 6.

p66SHC promotes mitochondrial inhibitor-induced mitophagy in B cells. (A) Flow cytometric analysis of TMRM-loaded ctr, p66, p66QQ, p66GFP and p66GFP-mLIR cells untreated or treated for 1 h with the mitophagy inducers oligomycin mix (A, B and C isomers) and antimycin A (OA). The histogram shows the percentages of TMRMlow (depolarized) cells (n ≥ 3). (B) Immunoblot analysis of MT-CO2/COXII and COX4I1/COXIV in ctr MEC cells or the MEC transfectants expressing wild-type p66SHC (p66) or the p66SHC-QQ (p66QQ) mutant, or GFP-tagged wild-type p66SHC (p66GFP) or the GFP-tagged p66SHC LIR mutant (p66GFP-mLIR), untreated or treated for 24 h with OA. ACTB was used as a loading control. (C) Quantification of MT-CO2 and COX4I1 in samples treated and analyzed as in B (n ≥ 3). (D) Left, quantification using Mander’s coefficient of the weighted colocalization of mCherry-GFP-FIS1 in the ctr and p66 MEC transfectant stably transfected with the mCherry-GFP-FIS1 construct, untreated or treated for 24 h with OA and labelled with anti-GFP and anti-RFP antibodies (≥ 10 cells/sample, n = 3). Right, representative images (medial optical sections) are shown. Size bar: 5 μm. The data are expressed as mean± SD. ****P ≤ 0.0001; ***P ≤ 0.001; **P ≤ 0.01; *P ≤ 0.05 (one-way ANOVA).
