Figure 3.
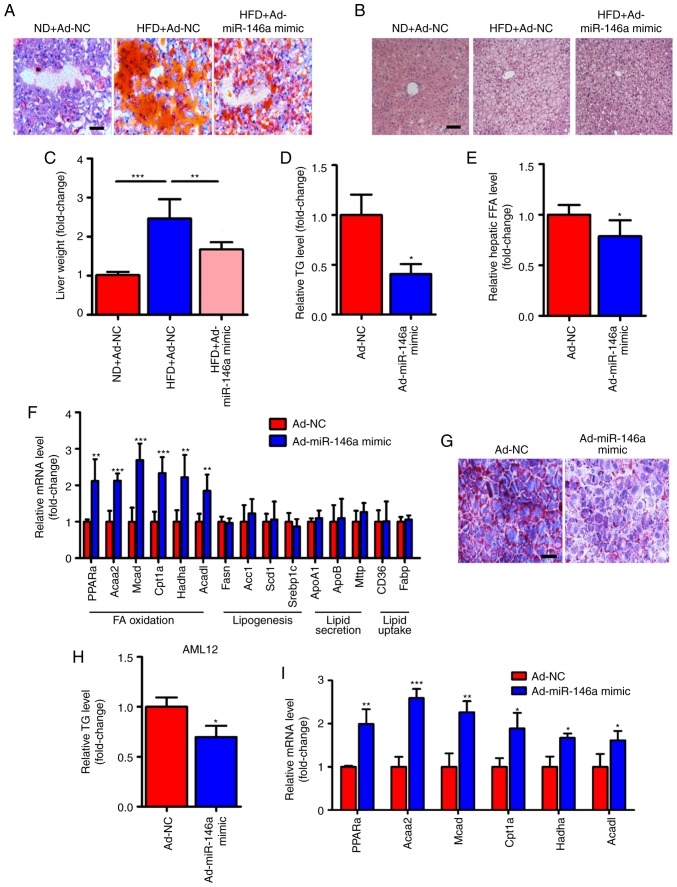
miR-146a attenuates lipid accumulation in the livers of HFD mice. (A-C) Representative images of Oil-red O staining (A) and H&E staining (B) of liver sections and relative liver weight (n=5) (C) of normal diet fed mice (ND) infected with Ad-NC, HFD mice infected with Ad-NC or Ad-miR-146a mimic. Scale bar, 100 µm. (D) Relative hepatic triglyceride (TG) levels of HFD mice infected with Ad-NC or Ad-miR-146a mimic (n=3). (E) Relative hepatic free fatty acid (FFA) in the HFD mice infected with Ad-NC or Ad-miR-146a mimic (n=5). (F) The relative mRNA levels of genes related to fatty acid oxidation (PPARa, Acaa2, Mcad, Cpt1a, Hadha and Acadl), de novo lipogenesis (Fasn, Acc1, Scd1 and Srebp1c), lipid secretion (ApoA1, ApoB and Mttp) and lipid uptake (CD36 and Fabp) in the livers of HFD mice infected with Ad-NC or Ad-miR-146a mimic (n=5 to 6). (G) Representative images of Oil-red O staining of AML12 cells transfected with NC or miR-146a mimic. Scale bar, 100 µm. (H) Quantitative analysis of cellular TAG content in AML12 cells transfected with NC or miR-146a mimic (n=3). (I) The relative mRNA levels of genes related to fatty acid oxidation in AML12 cells transfected with NC or miR-146a mimic (n=3). Means ± SD are shown. *P<0.05; **P<0.01; ***P<0.001.

