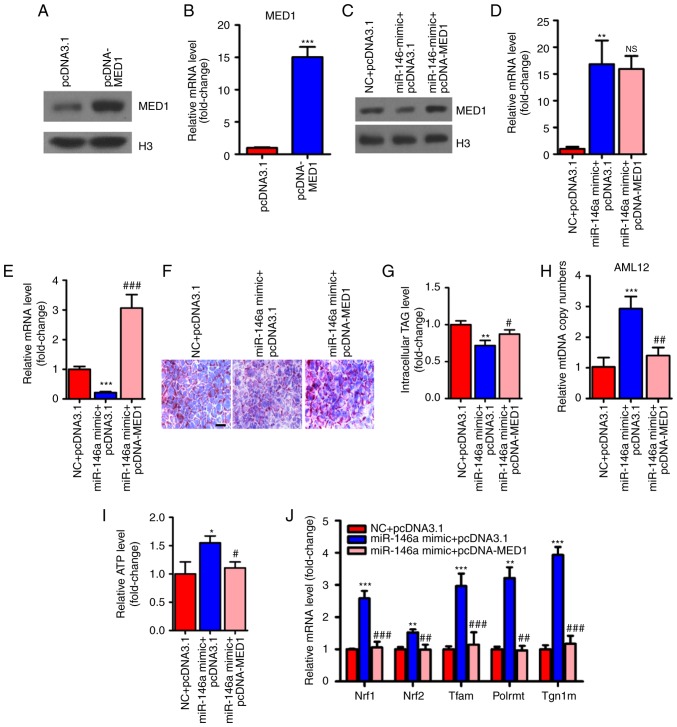
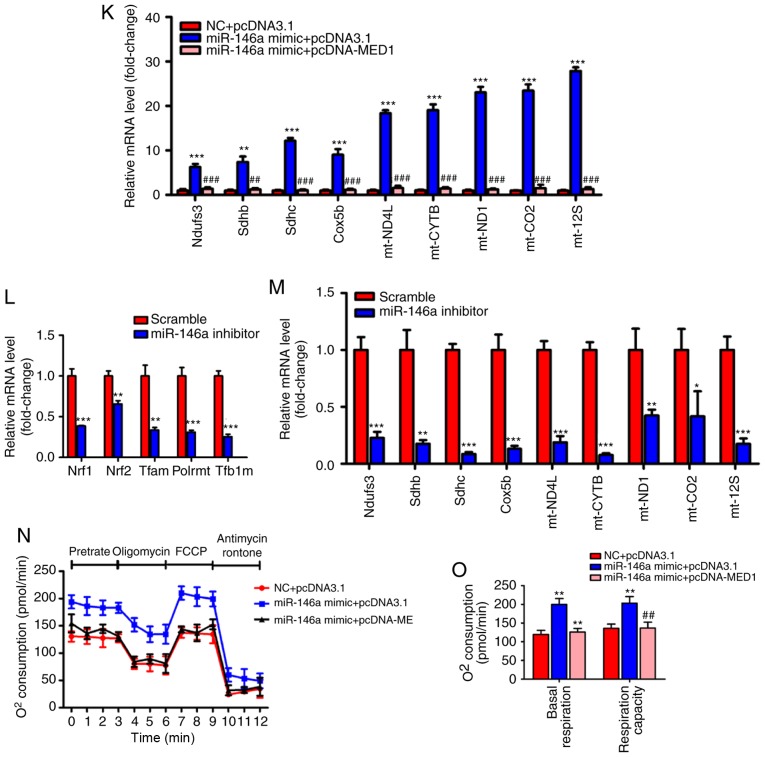
Figure 6.
Restoration of MED1 inhibits the metabolic action of miR-146a. (A and B) The protein levels (A) and relative mRNA levels (B, n=3) of MED1 in AML12 cells transfected with pcDNA3.1 or pcDNA-MED1. (C-E) The protein level of MED1 (C) and relative mRNA levels of miR-146a (D, n=3) and MED1 (E, n=3) in AML12 cells cotransfected with NC and pcDNA3.1, miR-146a mimic and pcDNA3.1 or miR-146a mimic and pcDNA-MED1. (F and G) Representative images of Oil-red O staining (F) and cellular TG content analysis (G) of AML12 cells transfected with NC and pcDNA3.1, miR-146a mimics and pcDNA3.1 or miR-146a mimic and pcDNA-MED1. Scale bar, 100 µm. (H and I) The relative mtDNA copy numbers (H) and ATP levels (I) in AML12 cells co-transfected with NC and pcDNA3.1, miR-146a mimic and pcDNA3.1 or miR-146a mimic and pcDNA-MED1 (n=3). (J) The relative mRNA expression level of nuclear respiratory factors (Nrf1 and Nrf2) and their downstream target genes (Tfam, Plormt and Tfb1m) in AML12 cells co-transfected with NC and pcDNA3.1, miR-146a mimic and pcDNA3.1 or miR-146a mimic and pcDNA-MED1 (n=3). Restoration of MED1 inhibits the metabolic action of miR-146a. (K) Relative mRNA expression of oxidative phosphorylation pathway-related genes in the nucleus (Ndufs3, Sdhb, Sdhc and Cox5b) and in mitochondria (ND4L, CYTB, ND1, COII, and 12SrRNA) in AML12 cells co-transfected with NC and pcDNA3.1, miR-146a mimic and pcDNA3.1 or miR-146a mimic and pcDNA-MED1 (n=3). (L) The relative mRNA expression level of nuclear respiratory factors and their downstream target genes in AML12 cells transfected with Scramble control or miR-146a inhibitor (n=3). (M) Relative mRNA expression of oxidative phosphorylation pathway-related genes in the nucleus and in mitochondria in AML12 cells transfected with Scramble control or miR-146a inhibitor (n=3). (N) Oxygen consumption of AML12 cells co-transfected with NC and pcDNA3.1, miR-146a mimic and pcDNA3.1 or miR-146a mimic and pcDNA-MED1 were analyzed with a Seahorse XF24 extracellular flux analyser (n=3). (O) Basal respiration and respiratory capacity oxygen consumption rates were measured and calculated (n=3). Means ± SD are shown. *P<0.05; **P<0.01; ***P<0.001 (vs. control group transfected with NC and pcDNA3.1), #P<0.05; ##P<0.01; ###P<0.001 (vs. the group transfected with miR-146a mimic and pcDNA3.1).


