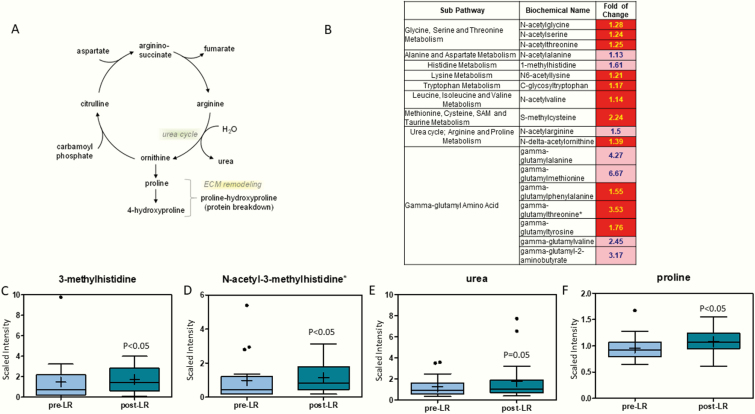
Figure 2.
(A) Pathway of urea and protein degradation cycle. (B) Heat map of statistically significant biochemical markers profiled in this study. Red shaded cells indicate P ≤ .05 (red indicates that the mean values are significantly higher for that comparison). Light red shaded cells indicate .05 < P < .10 (light red indicates that the mean values trend higher for that comparison). (C) 3-Methylhistidine and (D) N-acetyl-3-methylhistidine and metabolites of the urea cycle, (E) urea and (F) proline are increased with leptin therapy. The X-axis shows before and after leptin replacement (LR) and the Y-axis shows the relative scaled intensity for the metabolites measured. Within the boxplot, the mean value is represented by the plus sign, the median by the horizontal dividing line, and the top and bottom of the box represent the 75th and 25th percentile, with the whiskers indicating the maximum and minimum points and outlier points shown as filled circles.

